EX-99.2
Published on August 7, 2024
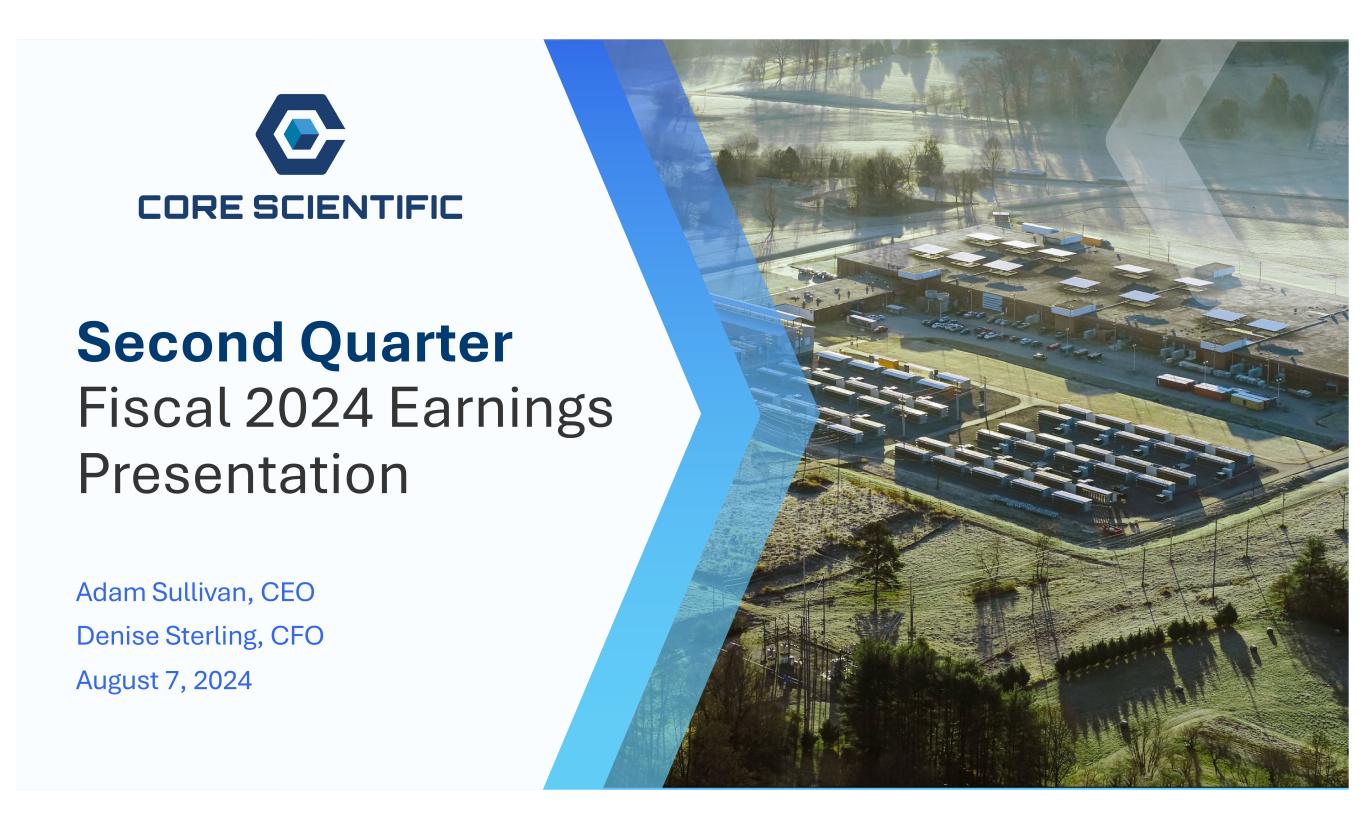
Second Quarter Fiscal 2024 Earnings Presentation Adam Sullivan, CEO Denise Sterling, CFO August 7, 2024
2 FORWARD-LOOKING STATEMENTS This presentation contains “forward-looking statements” within the meaning of the “safe harbor” provisions of the Private Securities Litigation Reform Act of 1995, including but not limited to, statements regarding projections, estimates and forecasts of revenue and other financial and performance metrics, projections of market opportunity and expectations, the Company’s ability to scale, and grow its business and execute on its growth plans and hosting contracts, source clean and renewable energy, the advantages, and expected growth, and anticipated future revenue of the Company, and the Company’s ability to source and retain talent. You can identify forward-looking statements by the fact that they do not relate strictly to historical or current facts. These statements may include words such as “aim,” “estimate,” “plan,” “project,” “forecast,” “goal,” “intend,” “will,” “expect,” “anticipate,” “believe,” “seek,” “target” or other similar expressions that predict or indicate future events or trends or that are not statements of historical matters. All forward looking statements are subject to risks and uncertainties that may cause actual results to differ materially, including: our ability to earn digital assets profitably and to attract customers for our digital asset and high performance compute hosting capabilities; our ability to perform under our existing colocation agreements, our ability to maintain our competitive position in our existing operating segments, the impact of increases in total network hash rate; our ability to raise additional capital to continue our expansion efforts or other operations; our need for significant electric power and the limited availability of power resources; the potential failure in our critical systems, facilities or services we provide; the physical risks and regulatory changes relating to climate change; potential significant changes to the method of validating blockchain transactions; our vulnerability to physical security breaches, which could disrupt our operations; a potential slowdown in market and economic conditions, particularly those impacting high performance computing, the blockchain industry and the blockchain hosting market; the identification of material weaknesses in our internal control over financial reporting; price volatility of digital assets and bitcoin in particular; the “halving” of rewards available on the Bitcoin network, affecting our ability to generate revenue; the potential that insufficient awards from digital asset mining could disincentivize transaction processors from expending processing power on a particular network, which could negatively impact the utility of the network and further reduce the value of its digital assets; the requirements of our existing debt agreements for us to sell our digital assets earned from mining as they are received, preventing us from recognizing any gain from appreciation in the value of the digital assets we hold; potential changes in the interpretive positions of the SEC or its staff with respect to digital asset mining firms; the increasing likelihood that U.S. federal and state legislatures and regulatory agencies will enact laws and regulations to regulate digital assets and digital asset intermediaries; increasing scrutiny and changing expectations with respect to our ESG policies; the effectiveness of our compliance and risk management methods; the adequacy of our sources of recovery if the digital assets held by us are lost, stolen or destroyed due to third-party digital asset services; the effects of our emergence from bankruptcy and our substantial level of indebtedness and our current liquidity constraints affecting our financial condition and ability to service our indebtedness. Any such forward-looking statements represent management’s estimates and beliefs as of the date of this presentation. While we may elect to update such forward-looking statements at some point in the future, we disclaim any obligation to do so, even if subsequent events cause our views to change. Year over year comparisons are based on the combined results of Core Scientific and its acquired entities. Although the Company believes that in making such forward-looking statements its expectations are based upon reasonable assumptions, such statements may be influenced by factors that could cause actual outcomes and results to be materially different from those projected. The Company cannot assure you that the assumptions upon which these statements are based will prove to have been correct. Additional important factors that may affect the Company’s business, results of operations and financial position are described from time to time in the Company’s Annual Report on Form 10-K for the year ended December 31, 2023, Quarterly Reports on Form 10-Q and the Company’s other filings with the Securities and Exchange Commission. The Company does not undertake any obligation to update or revise any forward-looking statement, whether as a result of new information, future events or otherwise, except as may be required by applicable law. NON-GAAP FINANCIAL MEASURES This presentation also contains non-GAAP financial measures as defined by the SEC rules, including Adjusted EBITDA and adjusted earnings (loss) per diluted share. The Company believes that these non-GAAP measures of financial results provide useful information to management and investors regarding certain financial and business trends relating to the Company's financial condition and results of operations. The Company's management uses certain of these non-GAAP measures to compare the Company's performance to that of prior periods for trend analyses and for budgeting and planning purposes. The Company urges investors not to rely on any single financial measure to evaluate its business.
3 Effectively managing post- halving impacts Diversifying hosting customer base into high- performance computing Expanding Texas data centers to support diversification strategy Convertible notes equitization eliminated $260M in debt from balance sheet Well positioned for continued growth and market leadership Secured long-term HPC hosting contracts totaling 382 Megawatts (MW) A leading producer of bitcoin generating adjusted EBITDA as HPC hosting business ramps
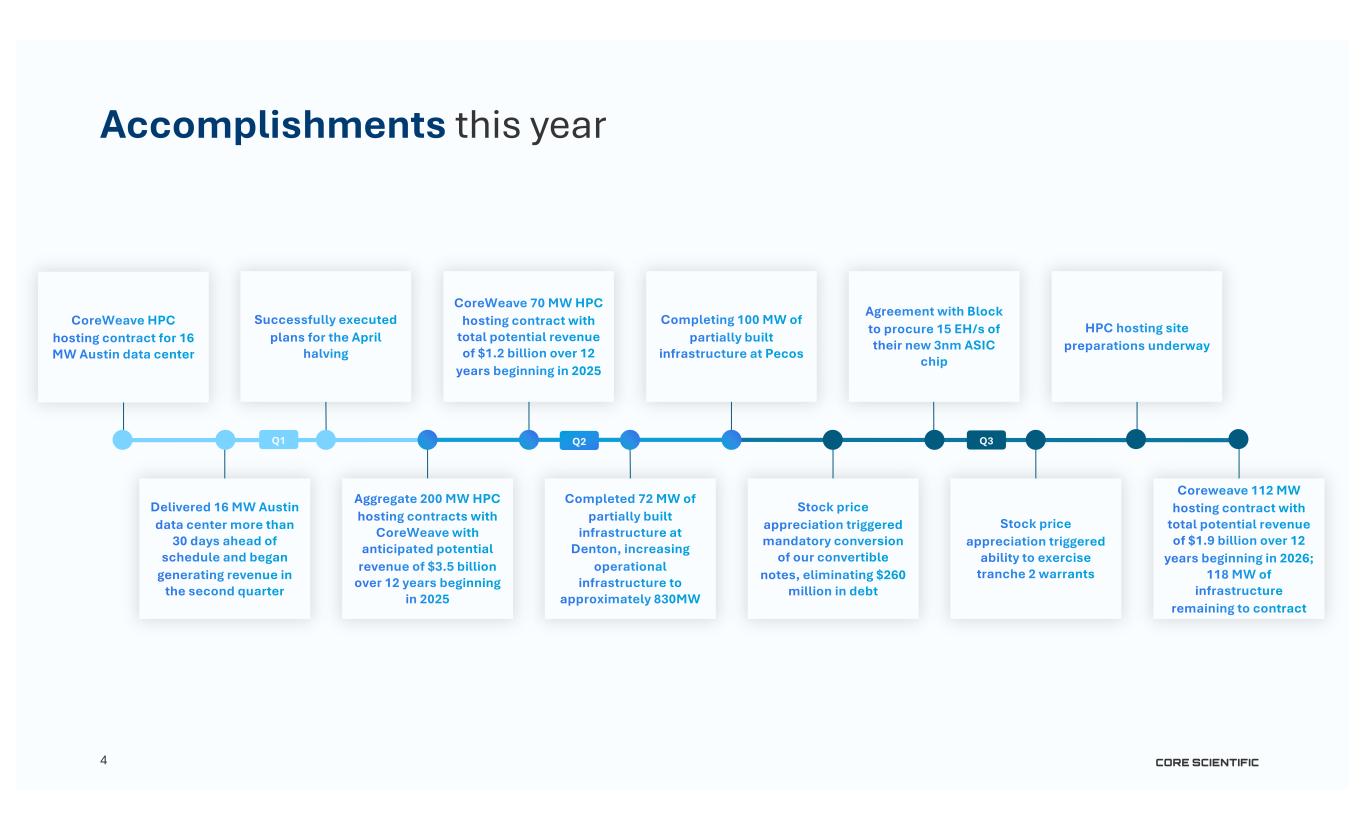
4 Accomplishments this year Q2Q1 Q3
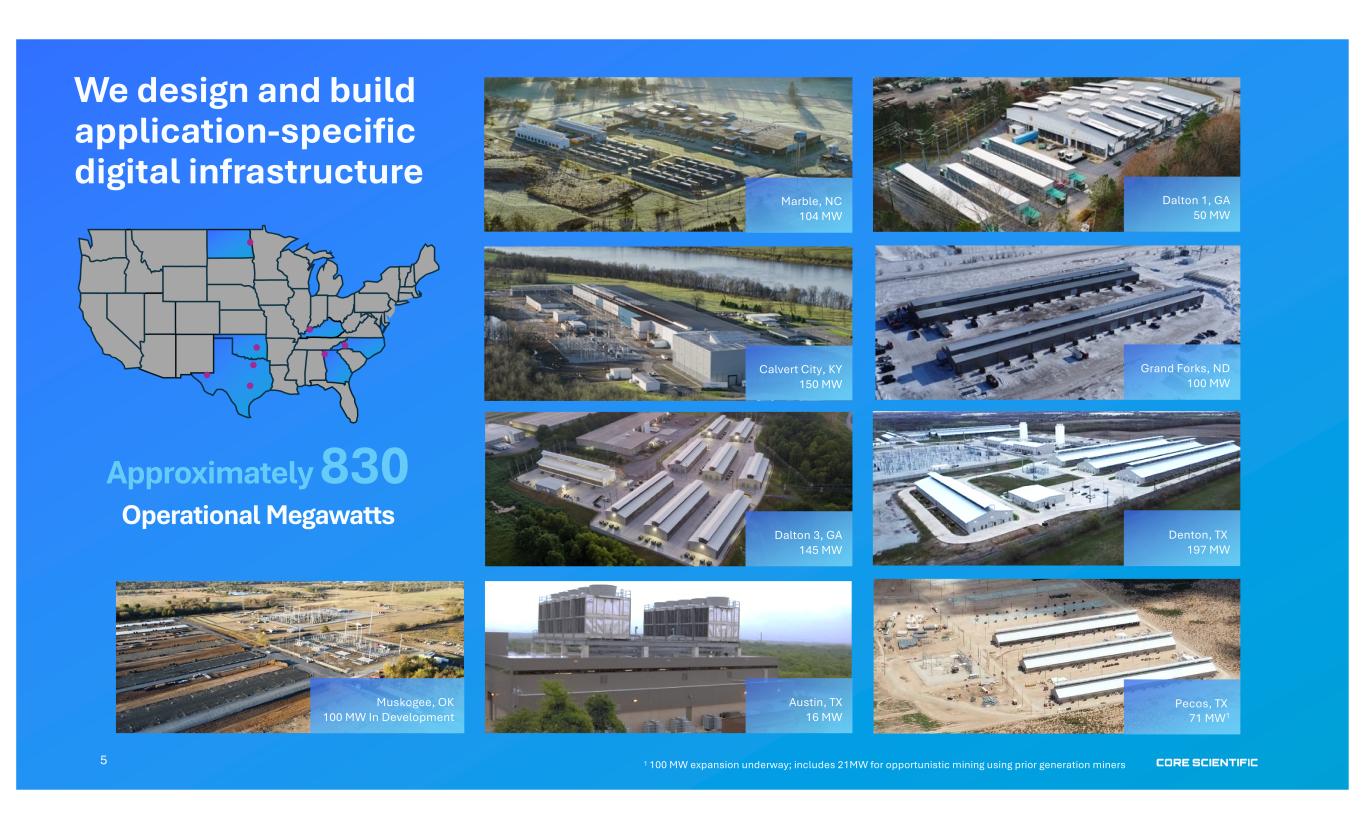
5 PROPRIETARY & CONFIDENTIAL 56 Commentary Cottonwood 56 Trailing 12 Month Performance(1) CapEx Investment Pecos, TX 250MW (Cottonwood 1 & 2) • Greenfield Buildout in 2022 • Campus has (2) phases – COT1 and COT2 • Core Scientific Leased • COT1 - (1) Operational Building totaling 50MW of energized capacity (~15k miners) with expansion capacity of additional 200MW • COT2 - (50) Operational containers totaling 21MW of energized capacity (~7.8k miners) • COT2 MW usage counts against total power allocation of 250MW from ERCOT • COT1 – 53k sq/ft production area • 7 Mining Ops FTEs • Utility Provider: TNMP Lease Information COT1 • Initial term expires Nov 2031; optional three, 10-year extensions (through Nov 2061) • Rent of $10k/acre ($600k) per 10-year term; rent escalates 20% per extension COT2 • Leased for 99 years (through 2122) • Paid full lease rent of $1m in 2023 88% Uptime 87% Hashrate Utilization 1.9 EH 97% Self-Mining Potential CapEx Projects • ~$500k CapEx for tech building • ~$250k CapEx for COT2 container field weatherization project • Complete COT1 200MW capacity expansion We design and build application-specific digital infrastructure Approximately 830 Operational Megawatts Pecos, TX 71 MW1 Austin, TX 16 MW Denton, TX 197 MW Calvert City, KY 150 MW Grand Forks, ND 100 MW Dalton 1, GA 50 MW Marble, NC 104 MW 1 100 MW expansion underway; includes 21MW for opportunistic mining using prior generation miners Muskogee, OK 100 MW In Development Dalton 3, GA 145 MW
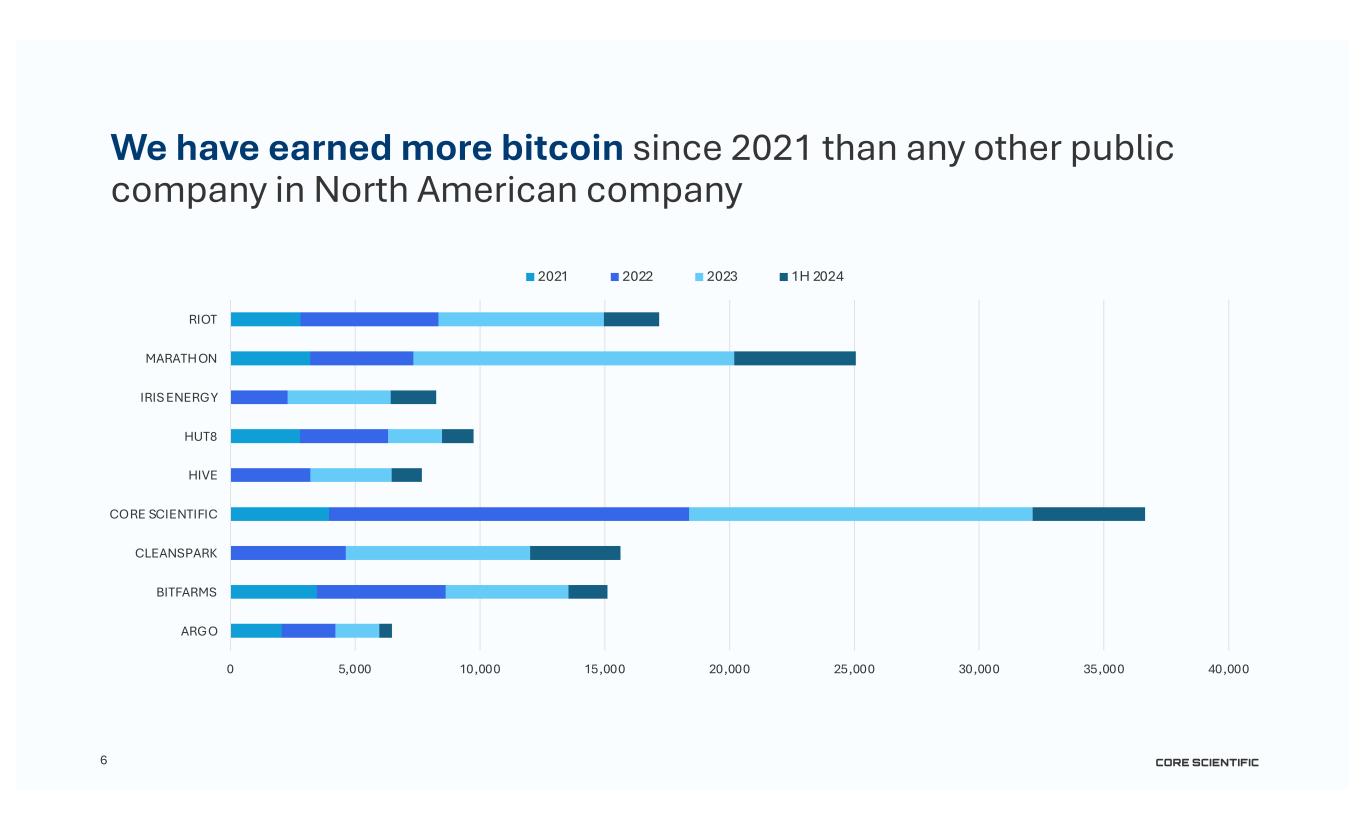
6 We have earned more bitcoin since 2021 than any other public company in North American company 0 5,000 10,000 15,000 20,000 25,000 30,000 35,000 40,000 ARGO BITFARMS CLEANSPARK CORE SCIENTIFIC HIVE HUT8 IRIS ENERGY MARATHON RIOT 2021 2022 2023 1H 2024
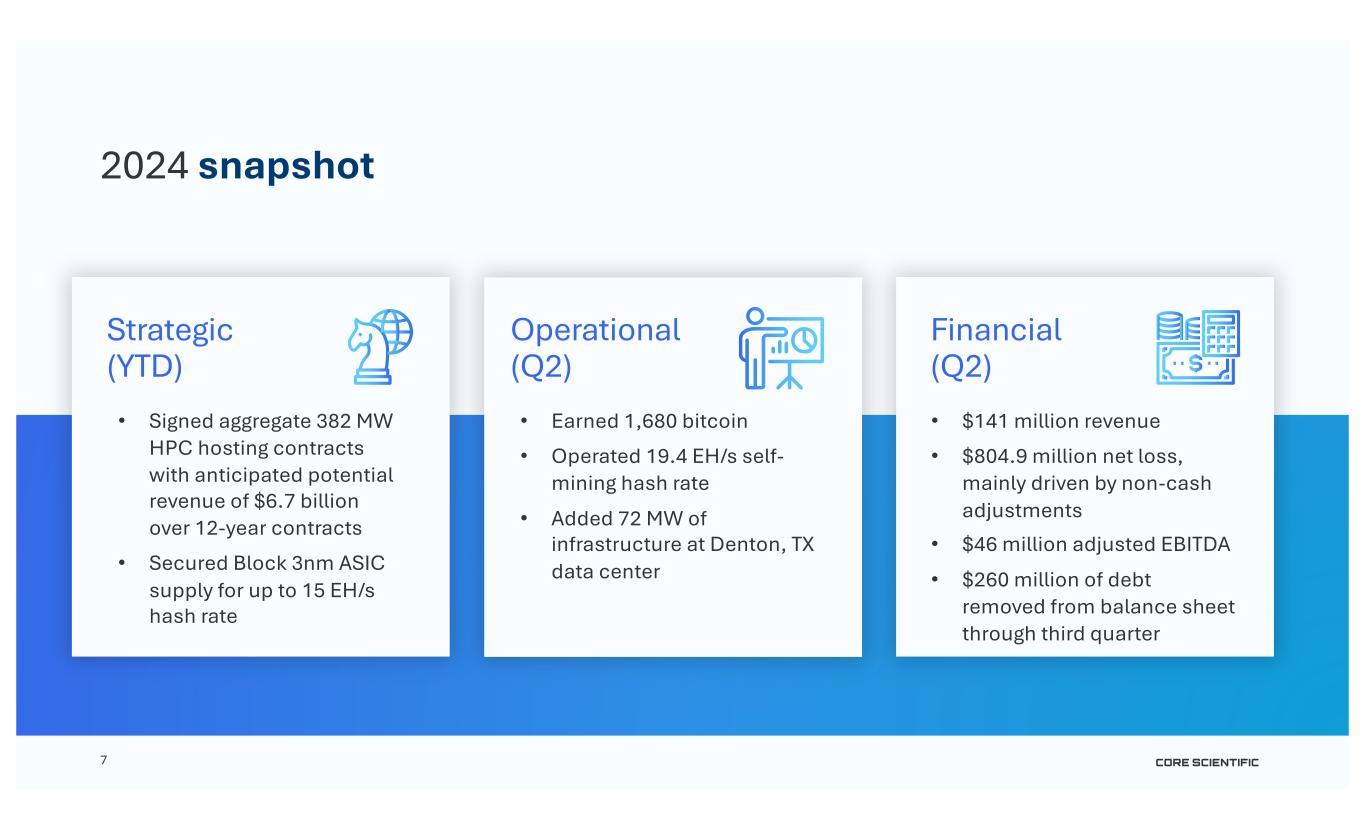
7 2024 snapshot Operational (Q2) Financial (Q2) • Signed aggregate 382 MW HPC hosting contracts with anticipated potential revenue of $6.7 billion over 12-year contracts • Secured Block 3nm ASIC supply for up to 15 EH/s hash rate • Earned 1,680 bitcoin • Operated 19.4 EH/s self- mining hash rate • Added 72 MW of infrastructure at Denton, TX data center • $141 million revenue • $804.9 million net loss, mainly driven by non-cash adjustments • $46 million adjusted EBITDA • $260 million of debt removed from balance sheet through third quarter Strategic (YTD)
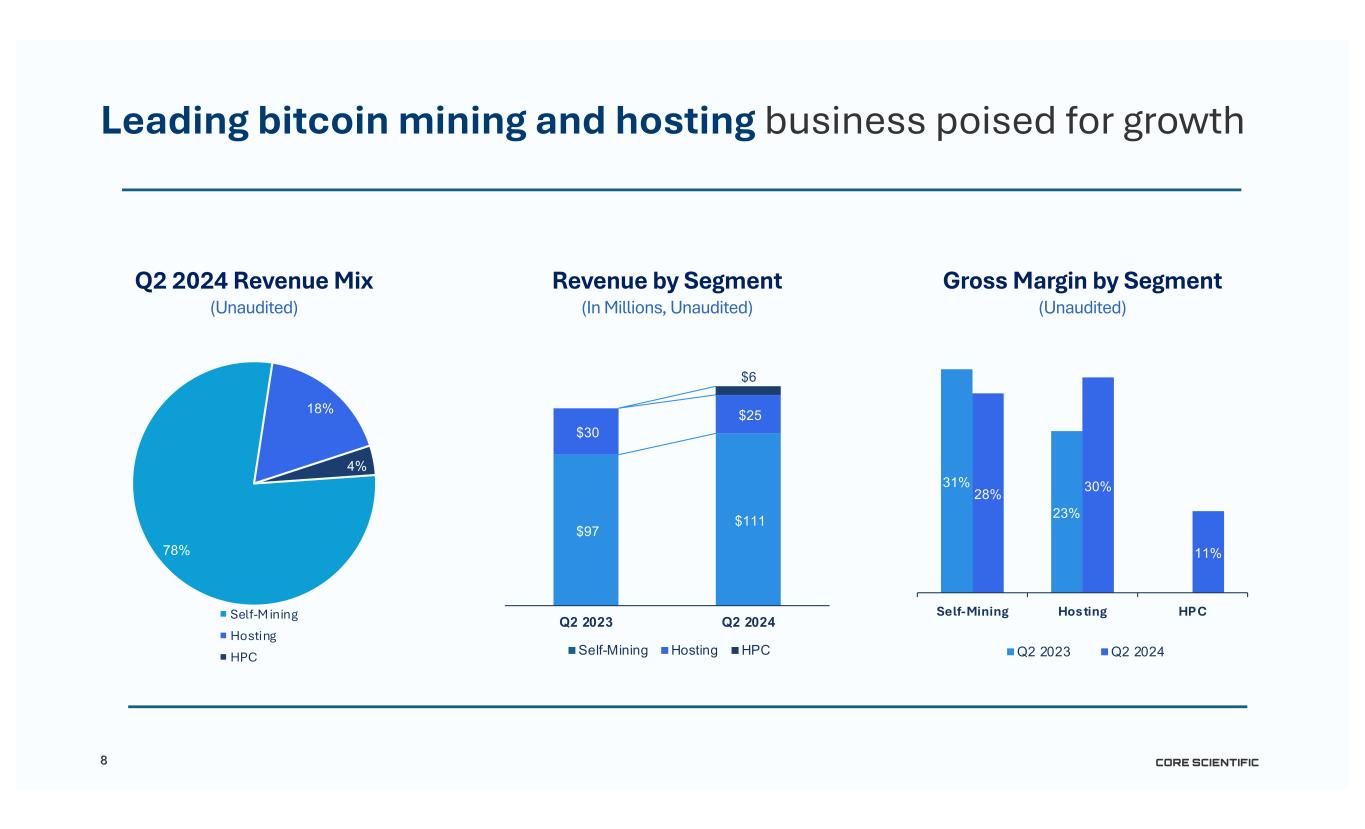
8 (Unaudited) Q2 2024 Revenue Mix (In Millions, Unaudited) Revenue by Segment Leading bitcoin mining and hosting business poised for growth 78% 18% 4% Self-M ining Hosting HPC $97 $111 $30 $25 $6 Q2 2023 Q2 2024 Self-Mining Hosting HPC (Unaudited) Gross Margin by Segment 31% 23% 0% 28% 30% 11% Self-Mining Hosting HPC Q2 2023 Q2 2024
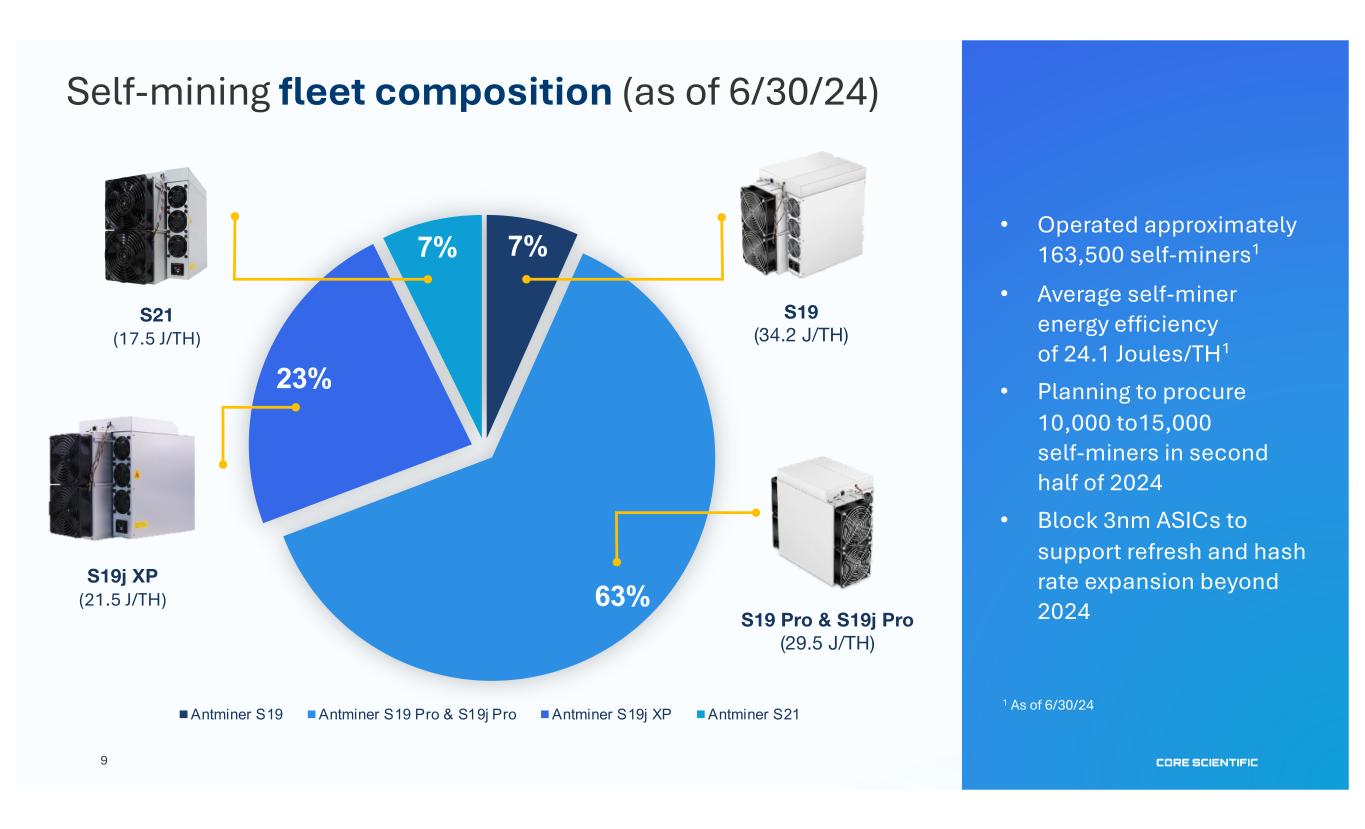
7% 63% 23% 7% Antminer S19 Antminer S19 Pro & S19j Pro Antminer S19j XP Antminer S21 S19j XP (21.5 J/TH) S19 (34.2 J/TH) S19 Pro & S19j Pro (29.5 J/TH) S21 (17.5 J/TH) Self-mining fleet composition (as of 6/30/24) • Operated approximately 163,500 self-miners1 • Average self-miner energy efficiency of 24.1 Joules/TH1 • Planning to procure 10,000 to15,000 self-miners in second half of 2024 • Block 3nm ASICs to support refresh and hash rate expansion beyond 2024 1 As of 6/30/24 9
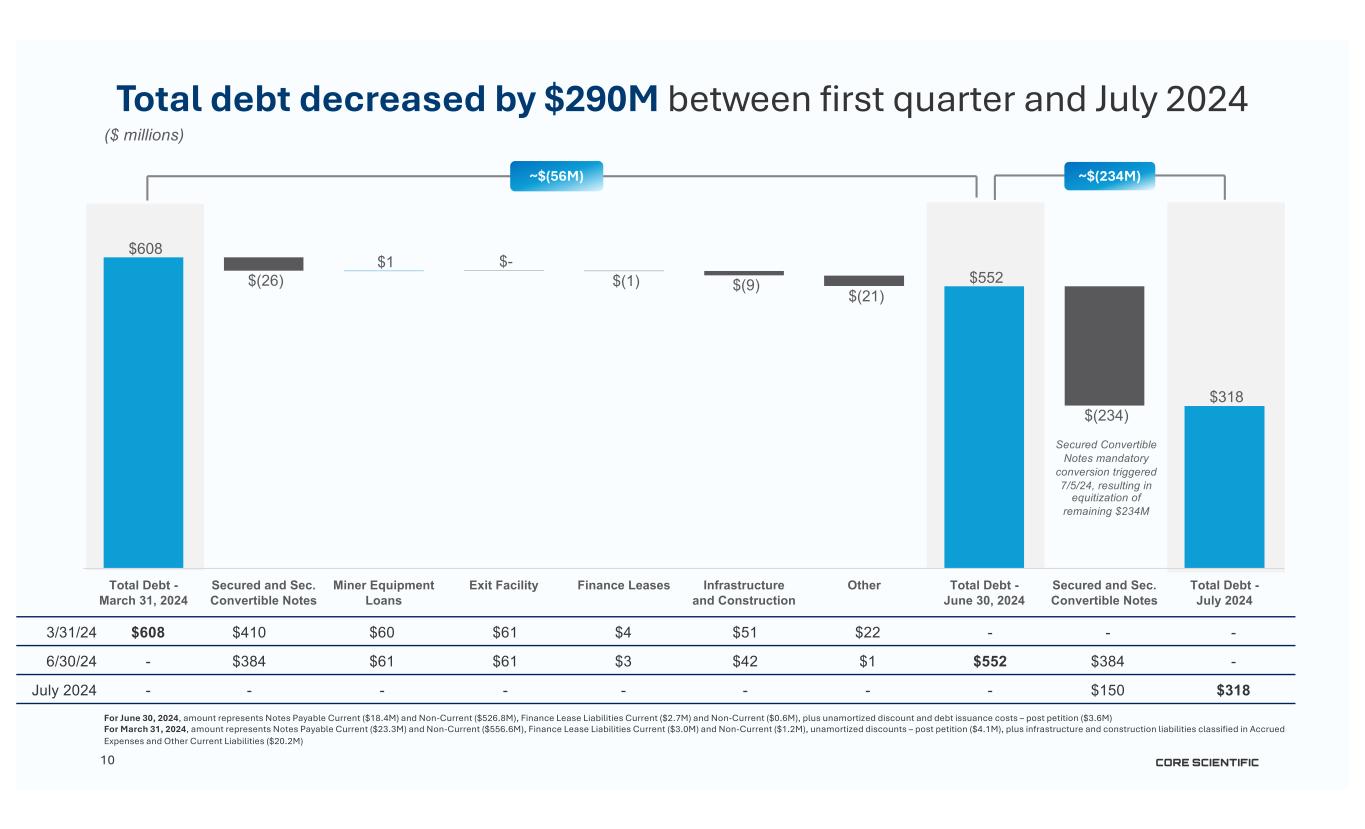
10 Total debt decreased by $290M between first quarter and July 2024 3/31/24 $608 $410 $60 $61 $4 $51 $22 - - - 6/30/24 - $384 $61 $61 $3 $42 $1 $552 $384 - July 2024 - - - - - - - - $150 $318 ~$(56M) ($ millions) $608 $(26) $1 $- $(1) $(9) $(21) $552 $(234) $318 Total Debt - March 31, 2024 Secured and Sec. Convertible Notes Miner Equipment Loans Exit Facility Finance Leases Infrastructure and Construction Other Total Debt - June 30, 2024 Secured and Sec. Convertible Notes Total Debt - July 2024 ~$(234M) Secured Convertible Notes mandatory conversion triggered 7/5/24, resulting in equitization of remaining $234M For June 30, 2024, amount represents Notes Payable Current ($18.4M) and Non-Current ($526.8M), Finance Lease Liabilities Current ($2.7M) and Non-Current ($0.6M), plus unamortized discount and debt issuance costs – post petition ($3.6M) For March 31, 2024, amount represents Notes Payable Current ($23.3M) and Non-Current ($556.6M), Finance Lease Liabilities Current ($3.0M) and Non-Current ($1.2M), unamortized discounts – post petition ($4.1M), plus infrastructure and construction liabilities classified in Accrued Expenses and Other Current Liabilities ($20.2M)
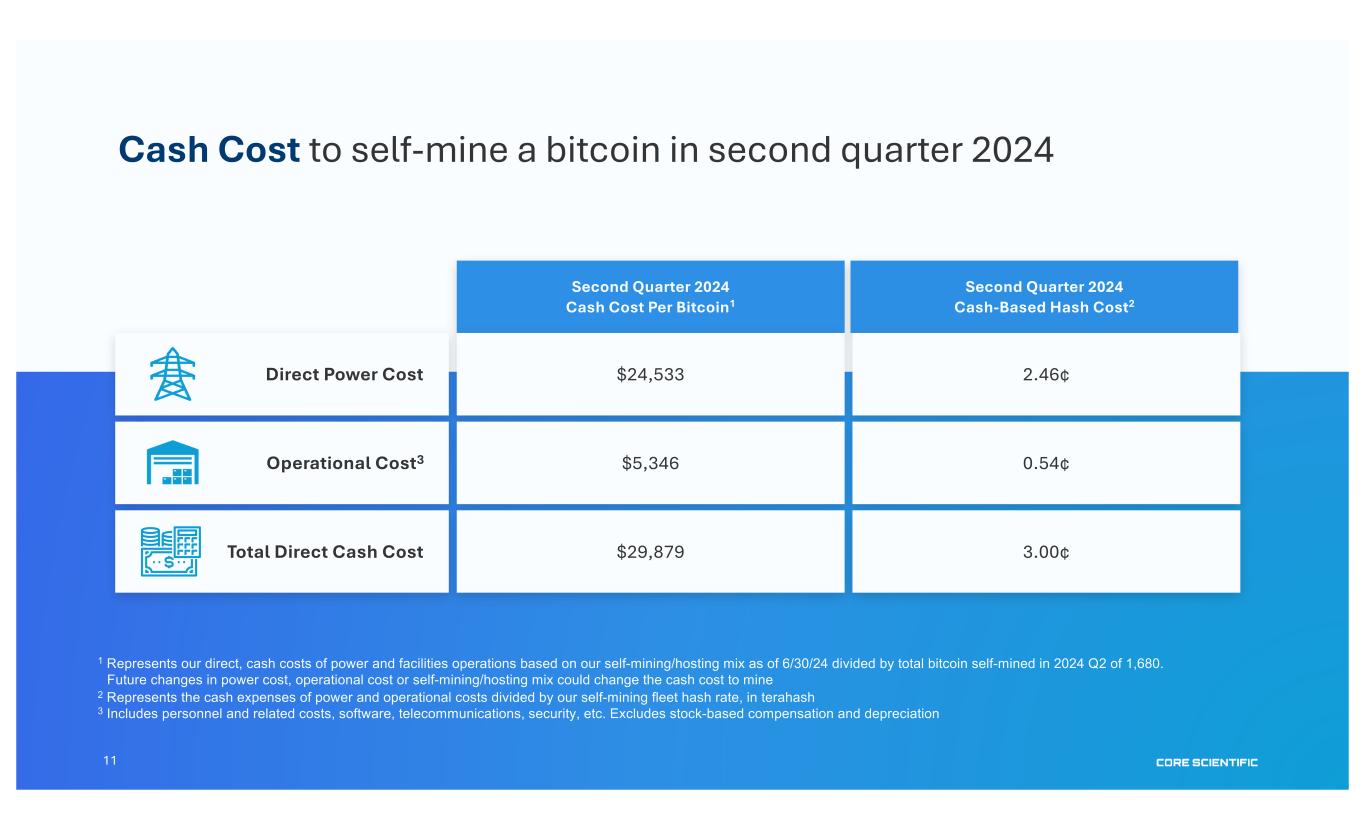
11 Cash Cost to self-mine a bitcoin in second quarter 2024 1 Represents our direct, cash costs of power and facilities operations based on our self-mining/hosting mix as of 6/30/24 divided by total bitcoin self-mined in 2024 Q2 of 1,680. Future changes in power cost, operational cost or self-mining/hosting mix could change the cash cost to mine 2 Represents the cash expenses of power and operational costs divided by our self-mining fleet hash rate, in terahash 3 Includes personnel and related costs, software, telecommunications, security, etc. Excludes stock-based compensation and depreciation 11 Second Quarter 2024 Cash Cost Per Bitcoin1 $24,533 Second Quarter 2024 Cash-Based Hash Cost2 2.46¢ $5,346 0.54¢ $29,879 3.00¢ Direct Power Cost Operational Cost3 Total Direct Cash Cost
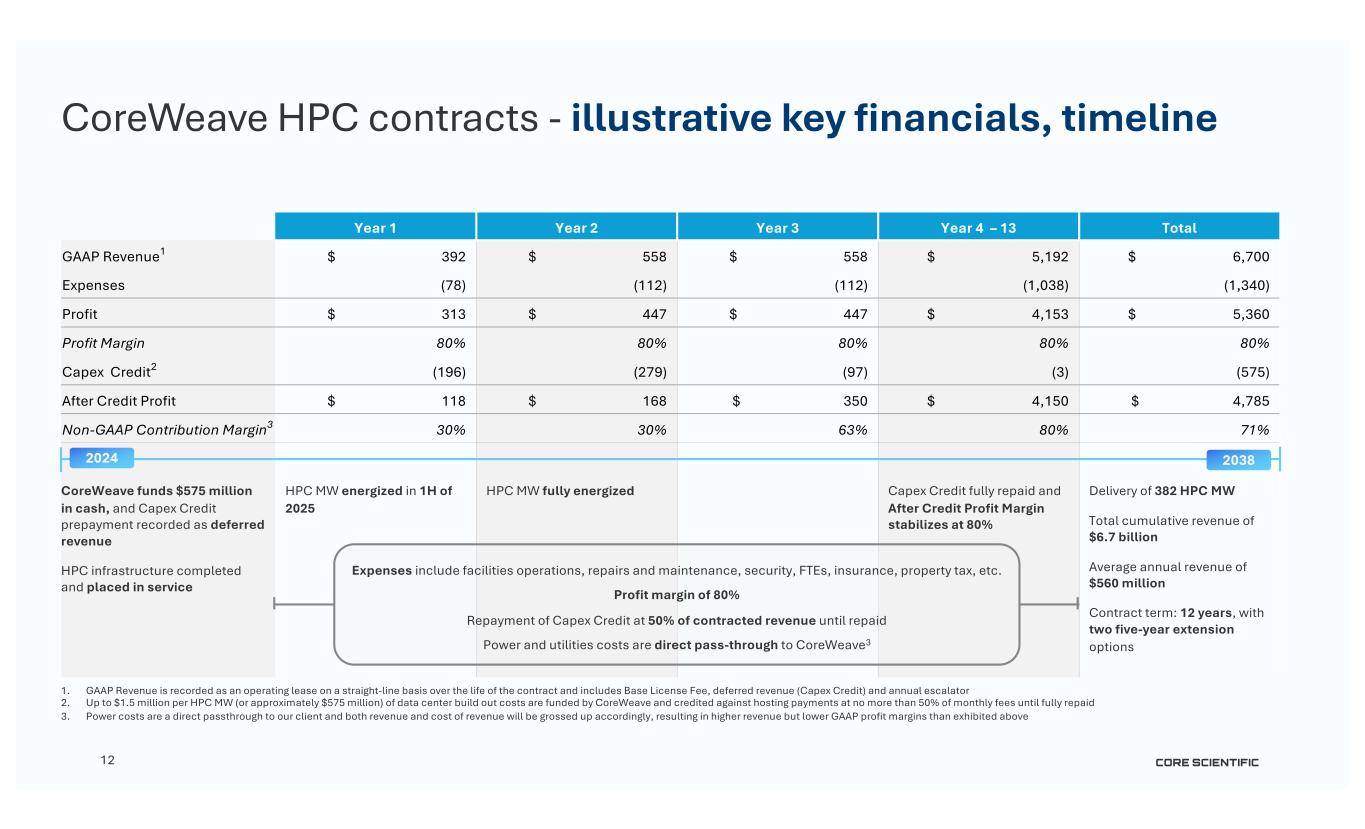
12 1. GAAP Revenue is recorded as an operating lease on a straight-line basis over the life of the contract and includes Base License Fee, deferred revenue (Capex Credit) and annual escalator 2. Up to $1.5 million per HPC MW (or approximately $575 million) of data center build out costs are funded by CoreWeave and credited against hosting payments at no more than 50% of monthly fees until fully repaid 3. Power costs are a direct passthrough to our client and both revenue and cost of revenue will be grossed up accordingly, resulting in higher revenue but lower GAAP profit margins than exhibited above Year 1 Year 2 Year 3 Year 4 – 13 Total GAAP Revenue1 $ 392 $ 558 $ 558 $ 5,192 $ 6,700 Expenses (78) (112) (112) (1,038) (1,340) Profit $ 313 $ 447 $ 447 $ 4,153 $ 5,360 Profit Margin 80% 80% 80% 80% 80% Capex Credit2 (196) (279) (97) (3) (575) After Credit Profit $ 118 $ 168 $ 350 $ 4,150 $ 4,785 Non-GAAP Contribution Margin3 30% 30% 63% 80% 71% CoreWeave funds $575 million in cash, and Capex Credit prepayment recorded as deferred revenue HPC infrastructure completed and placed in service HPC MW energized in 1H of 2025 HPC MW fully energized Capex Credit fully repaid and After Credit Profit Margin stabilizes at 80% Delivery of 382 HPC MW Total cumulative revenue of $6.7 billion Average annual revenue of $560 million Contract term: 12 years, with two five-year extension options CoreWeave HPC contracts - illustrative key financials, timeline 2024 2038 Expenses include facilities operations, repairs and maintenance, security, FTEs, insurance, property tax, etc. Profit margin of 80% Repayment of Capex Credit at 50% of contracted revenue until repaid Power and utilities costs are direct pass-through to CoreWeave3
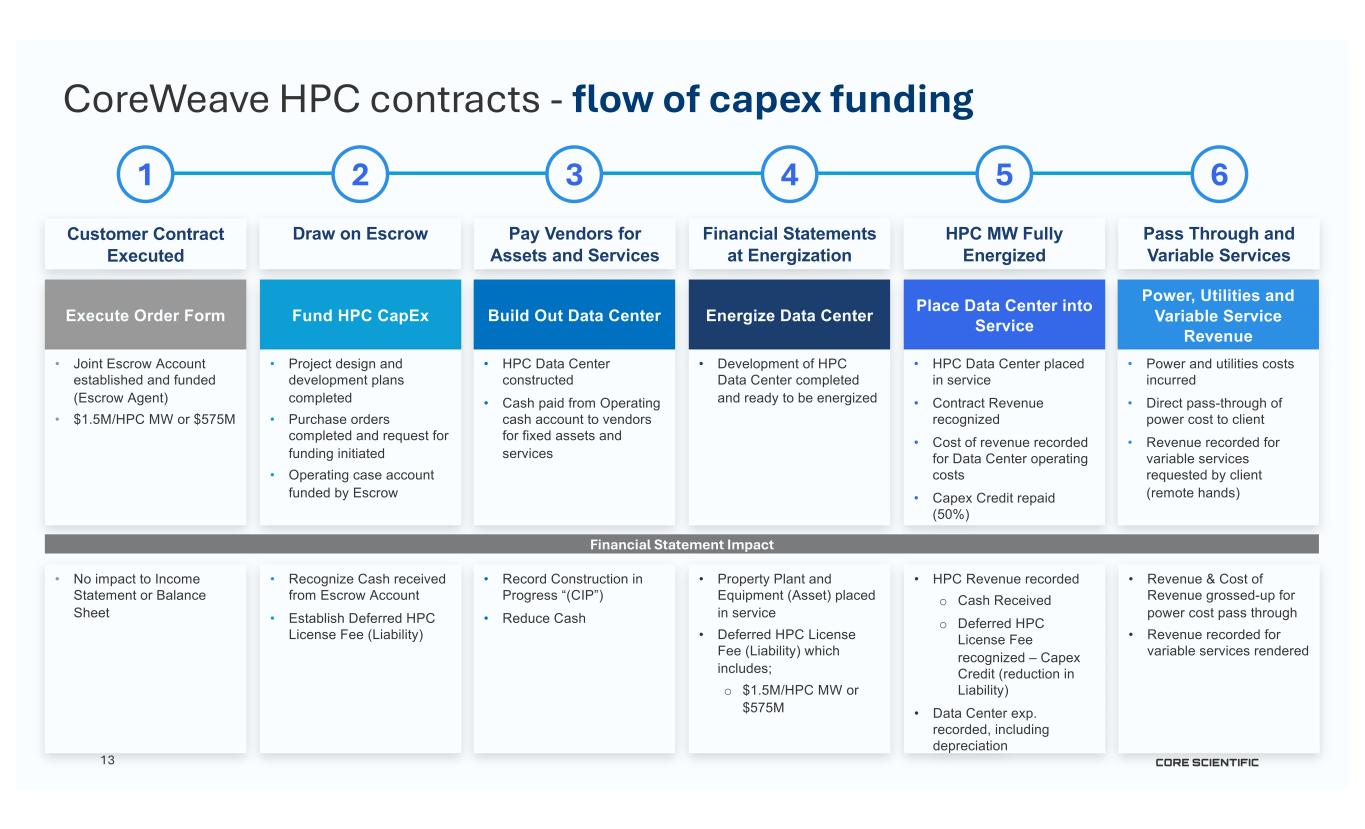
13 CoreWeave HPC contracts - flow of capex funding Customer Contract Executed 1 Draw on Escrow 2 Execute Order Form • Joint Escrow Account established and funded (Escrow Agent) • $1.5M/HPC MW or $575M 3 Pay Vendors for Assets and Services 4 Financial Statements at Energization 5 HPC MW Fully Energized 6 Pass Through and Variable Services Fund HPC CapEx • Project design and development plans completed • Purchase orders completed and request for funding initiated • Operating case account funded by Escrow Build Out Data Center • HPC Data Center constructed • Cash paid from Operating cash account to vendors for fixed assets and services Energize Data Center • Development of HPC Data Center completed and ready to be energized Place Data Center into Service • HPC Data Center placed in service • Contract Revenue recognized • Cost of revenue recorded for Data Center operating costs • Capex Credit repaid (50%) Power, Utilities and Variable Service Revenue • Power and utilities costs incurred • Direct pass-through of power cost to client • Revenue recorded for variable services requested by client (remote hands) • No impact to Income Statement or Balance Sheet Financial Statement Impact • Recognize Cash received from Escrow Account • Establish Deferred HPC License Fee (Liability) • Record Construction in Progress “(CIP”) • Reduce Cash • Property Plant and Equipment (Asset) placed in service • Deferred HPC License Fee (Liability) which includes; o $1.5M/HPC MW or $575M • HPC Revenue recorded o Cash Received o Deferred HPC License Fee recognized – Capex Credit (reduction in Liability) • Data Center exp. recorded, including depreciation • Revenue & Cost of Revenue grossed-up for power cost pass through • Revenue recorded for variable services rendered
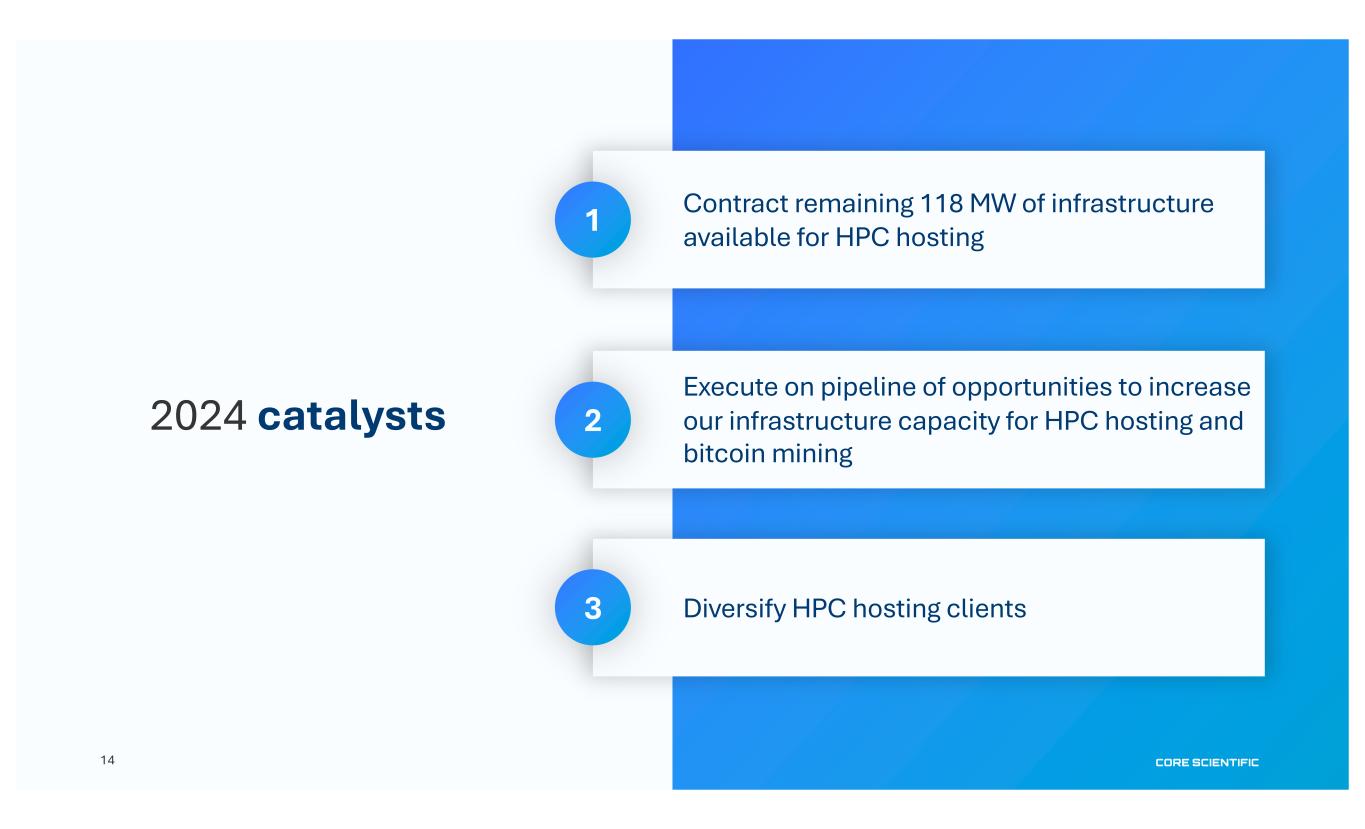
CORE SCIENTIFIC14 2024 catalysts Contract remaining 118 MW of infrastructure available for HPC hosting Execute on pipeline of opportunities to increase our infrastructure capacity for HPC hosting and bitcoin mining Diversify HPC hosting clients 1 2 3
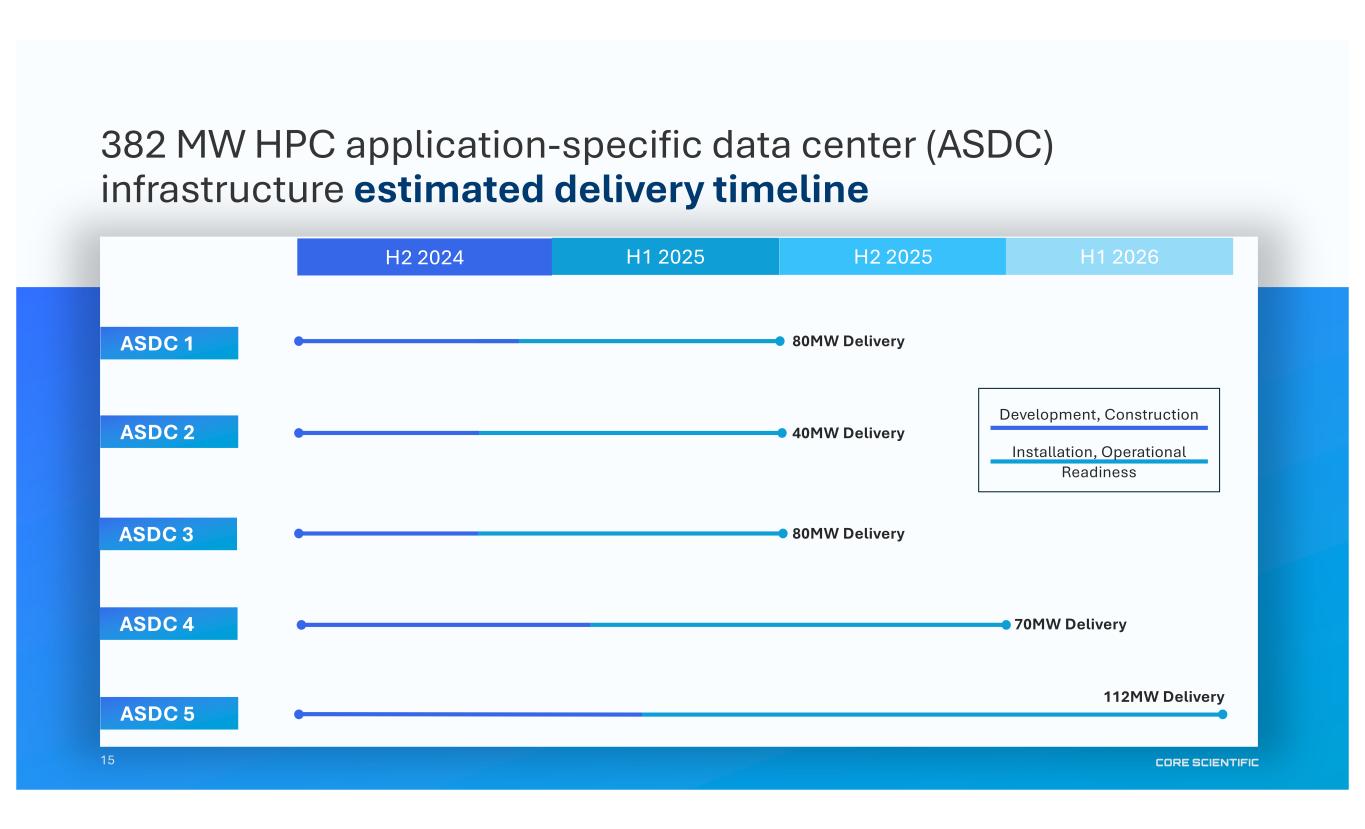
15 382 MW HPC application-specific data center (ASDC) infrastructure estimated delivery timeline H2 2024 80MW Delivery 40MW Delivery 80MW Delivery ASDC 1 ASDC 2 ASDC 3 H1 2025 H2 2025 H1 2026 ASDC 4 112MW Delivery ASDC 5 70MW Delivery Development, Construction Installation, Operational Readiness
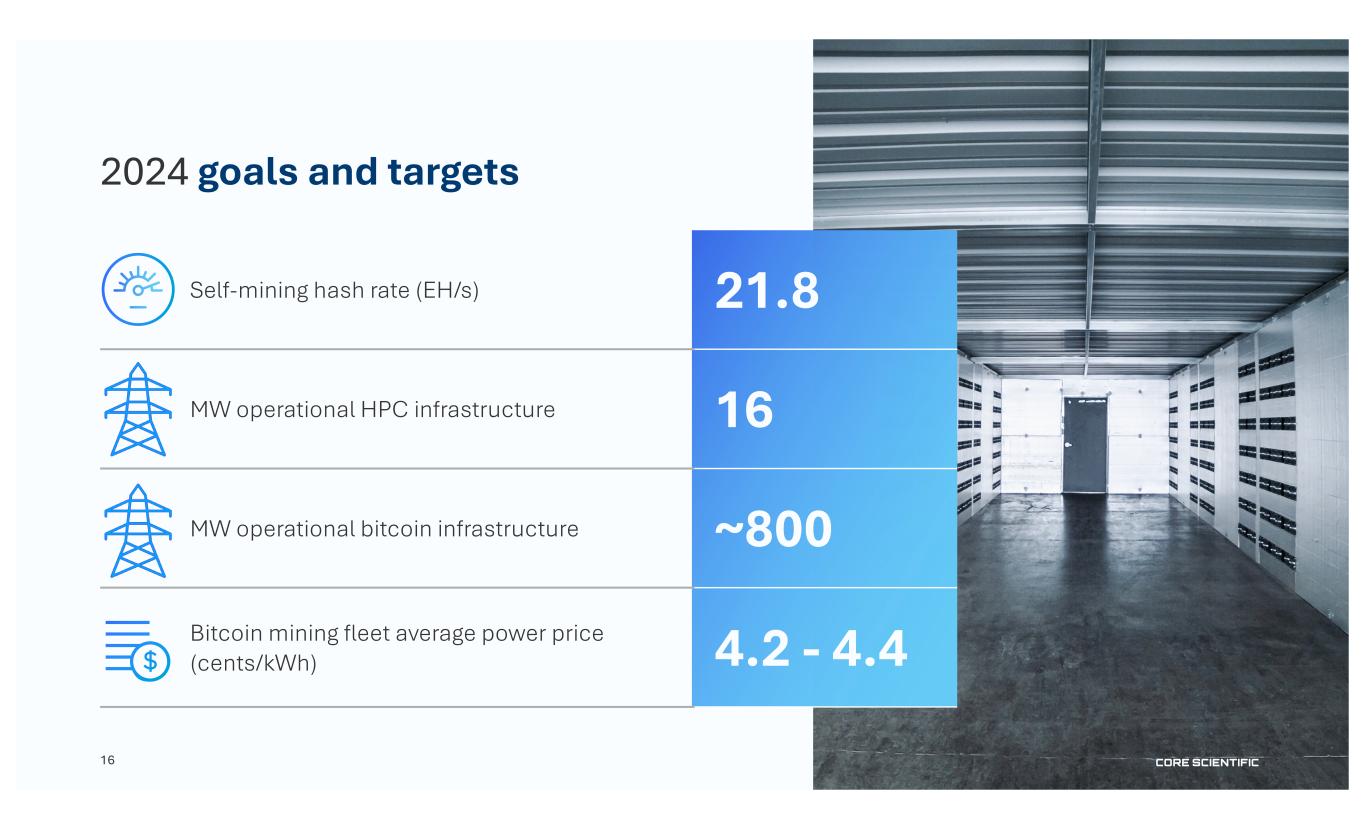
16 2024 goals and targets Self-mining hash rate (EH/s) 21.8 MW operational HPC infrastructure 16 MW operational bitcoin infrastructure ~800 Bitcoin mining fleet average power price (cents/kWh) 4.2 - 4.4
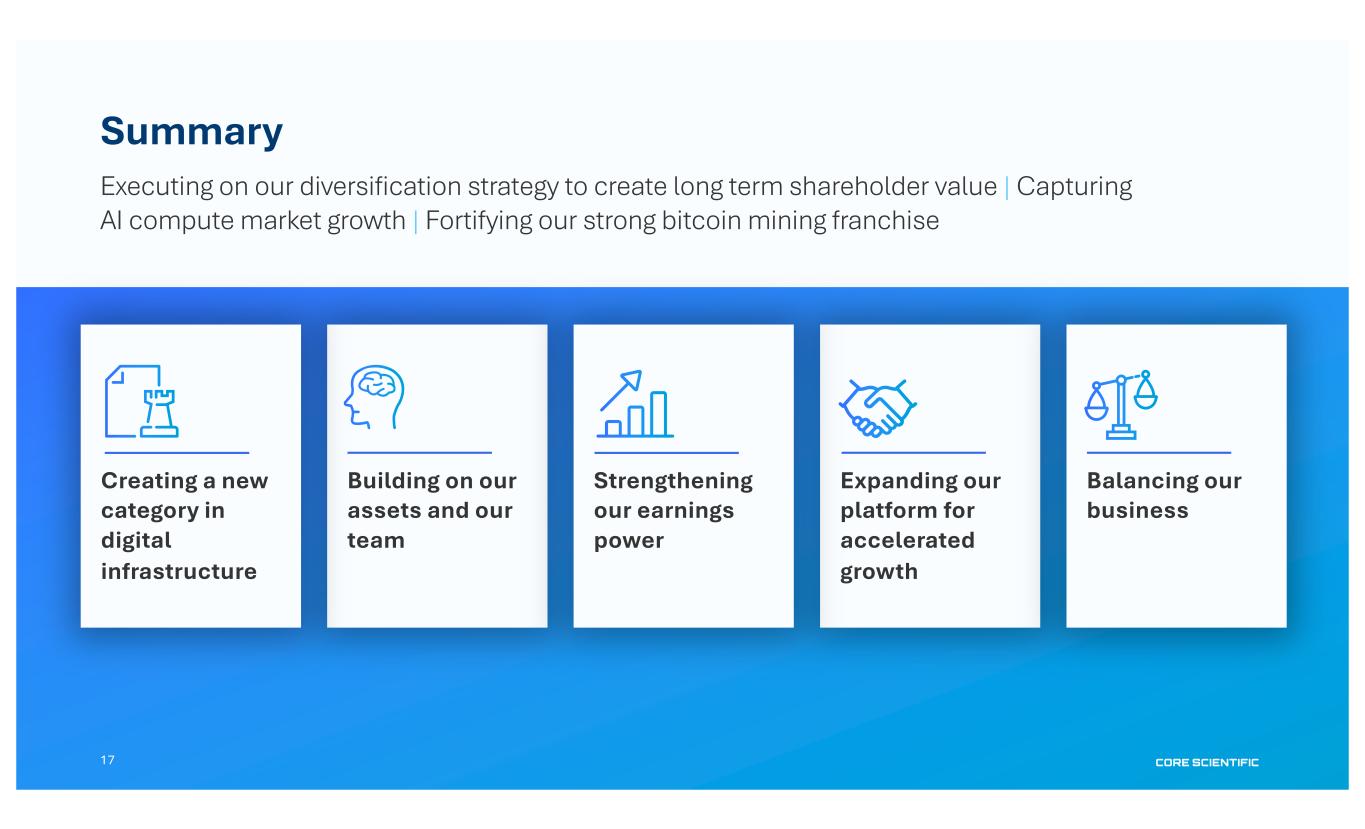
17 Summary Executing on our diversification strategy to create long term shareholder value | Capturing AI compute market growth | Fortifying our strong bitcoin mining franchise Expanding our platform for accelerated growth Building on our assets and our team Strengthening our earnings power Balancing our business Creating a new category in digital infrastructure
18 Appendix
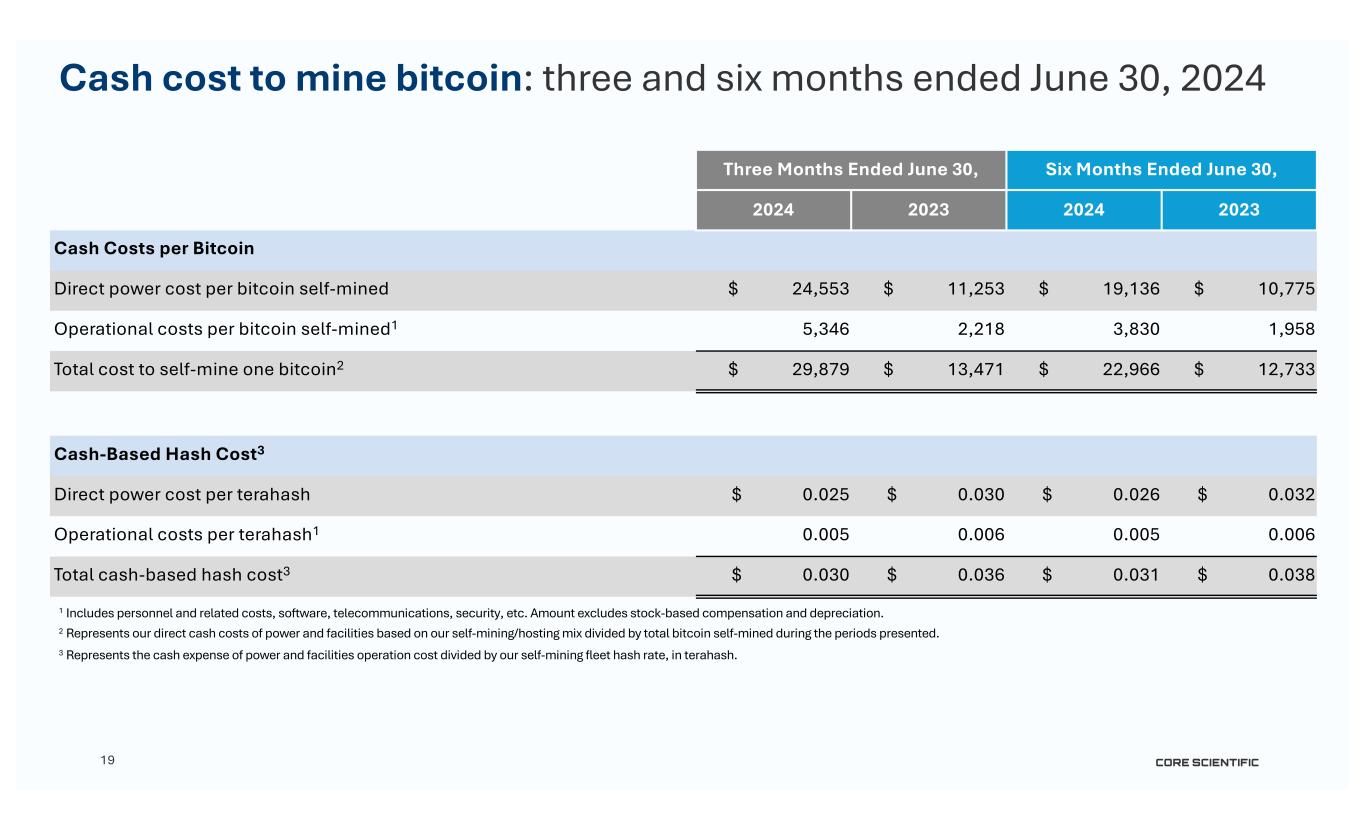
19 Three Months Ended June 30, Six Months Ended June 30, 2024 2023 2024 2023 Cash Costs per Bitcoin Direct power cost per bitcoin self-mined $ 24,553 $ 11,253 $ 19,136 $ 10,775 Operational costs per bitcoin self-mined1 5,346 2,218 3,830 1,958 Total cost to self-mine one bitcoin2 $ 29,879 $ 13,471 $ 22,966 $ 12,733 Cash-Based Hash Cost3 Direct power cost per terahash $ 0.025 $ 0.030 $ 0.026 $ 0.032 Operational costs per terahash1 0.005 0.006 0.005 0.006 Total cash-based hash cost3 $ 0.030 $ 0.036 $ 0.031 $ 0.038 Cash cost to mine bitcoin: three and six months ended June 30, 2024 1 Includes personnel and related costs, software, telecommunications, security, etc. Amount excludes stock-based compensation and depreciation. 2 Represents our direct cash costs of power and facilities based on our self-mining/hosting mix divided by total bitcoin self-mined during the periods presented. 3 Represents the cash expense of power and facilities operation cost divided by our self-mining fleet hash rate, in terahash.
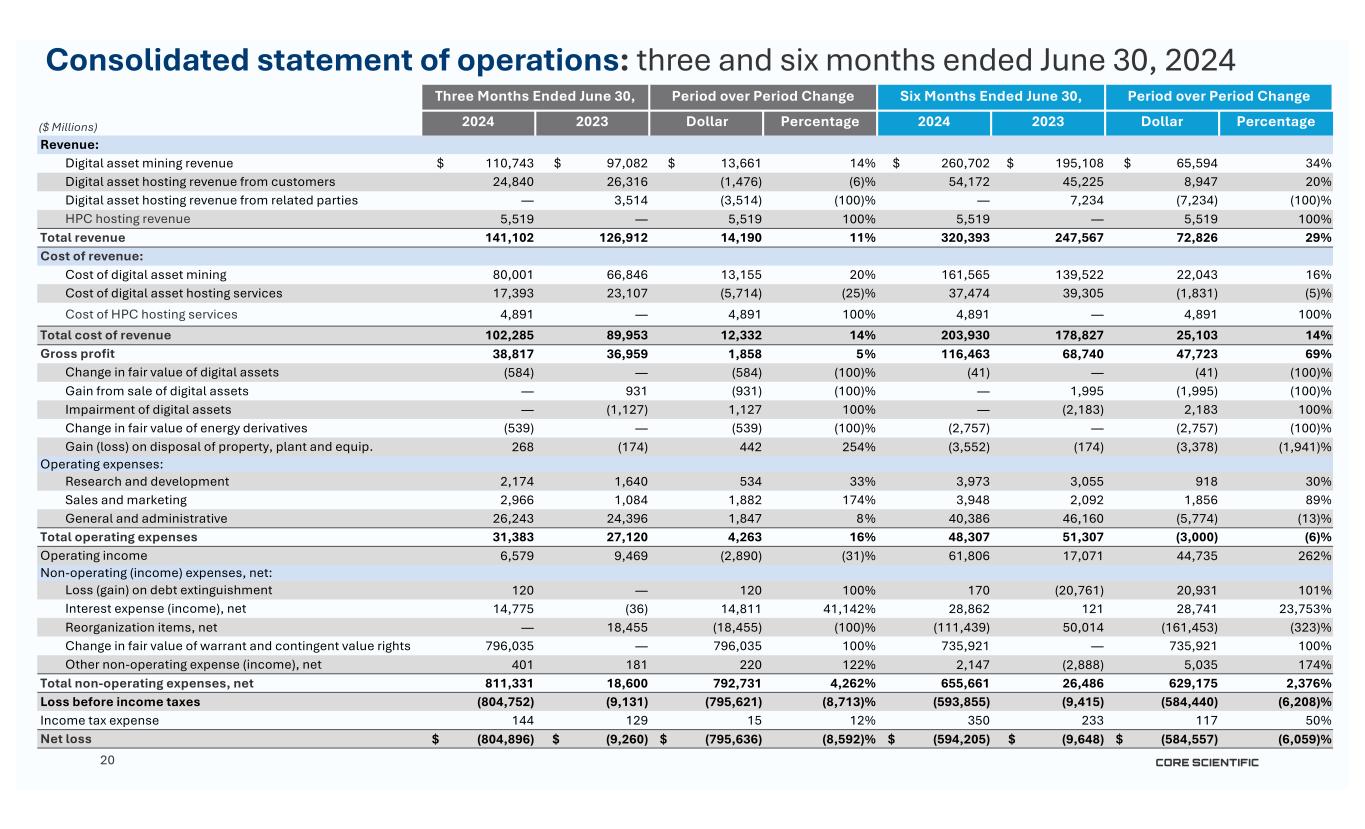
20 Three Months Ended June 30, Period over Period Change Six Months Ended June 30, Period over Period Change 2024 2023 Dollar Percentage 2024 2023 Dollar Percentage Revenue: Digital asset mining revenue $ 110,743 $ 97,082 $ 13,661 14% $ 260,702 $ 195,108 $ 65,594 34% Digital asset hosting revenue from customers 24,840 26,316 (1,476) (6)% 54,172 45,225 8,947 20% Digital asset hosting revenue from related parties — 3,514 (3,514) (100)% — 7,234 (7,234) (100)% HPC hosting revenue 5,519 — 5,519 100% 5,519 — 5,519 100% Total revenue 141,102 126,912 14,190 11% 320,393 247,567 72,826 29% Cost of revenue: Cost of digital asset mining 80,001 66,846 13,155 20% 161,565 139,522 22,043 16% Cost of digital asset hosting services 17,393 23,107 (5,714) (25)% 37,474 39,305 (1,831) (5)% Cost of HPC hosting services 4,891 — 4,891 100% 4,891 — 4,891 100% Total cost of revenue 102,285 89,953 12,332 14% 203,930 178,827 25,103 14% Gross profit 38,817 36,959 1,858 5% 116,463 68,740 47,723 69% Change in fair value of digital assets (584) — (584) (100)% (41) — (41) (100)% Gain from sale of digital assets — 931 (931) (100)% — 1,995 (1,995) (100)% Impairment of digital assets — (1,127) 1,127 100% — (2,183) 2,183 100% Change in fair value of energy derivatives (539) — (539) (100)% (2,757) — (2,757) (100)% Gain (loss) on disposal of property, plant and equip. 268 (174) 442 254% (3,552) (174) (3,378) (1,941)% Operating expenses: Research and development 2,174 1,640 534 33% 3,973 3,055 918 30% Sales and marketing 2,966 1,084 1,882 174% 3,948 2,092 1,856 89% General and administrative 26,243 24,396 1,847 8% 40,386 46,160 (5,774) (13)% Total operating expenses 31,383 27,120 4,263 16% 48,307 51,307 (3,000) (6)% Operating income 6,579 9,469 (2,890) (31)% 61,806 17,071 44,735 262% Non-operating (income) expenses, net: Loss (gain) on debt extinguishment 120 — 120 100% 170 (20,761) 20,931 101% Interest expense (income), net 14,775 (36) 14,811 41,142% 28,862 121 28,741 23,753% Reorganization items, net — 18,455 (18,455) (100)% (111,439) 50,014 (161,453) (323)% Change in fair value of warrant and contingent value rights 796,035 — 796,035 100% 735,921 — 735,921 100% Other non-operating expense (income), net 401 181 220 122% 2,147 (2,888) 5,035 174% Total non-operating expenses, net 811,331 18,600 792,731 4,262% 655,661 26,486 629,175 2,376% Loss before income taxes (804,752) (9,131) (795,621) (8,713)% (593,855) (9,415) (584,440) (6,208)% Income tax expense 144 129 15 12% 350 233 117 50% Net loss $ (804,896) $ (9,260) $ (795,636) (8,592)% $ (594,205) $ (9,648) $ (584,557) (6,059)% Consolidated statement of operations: three and six months ended June 30, 2024 ($ Millions)
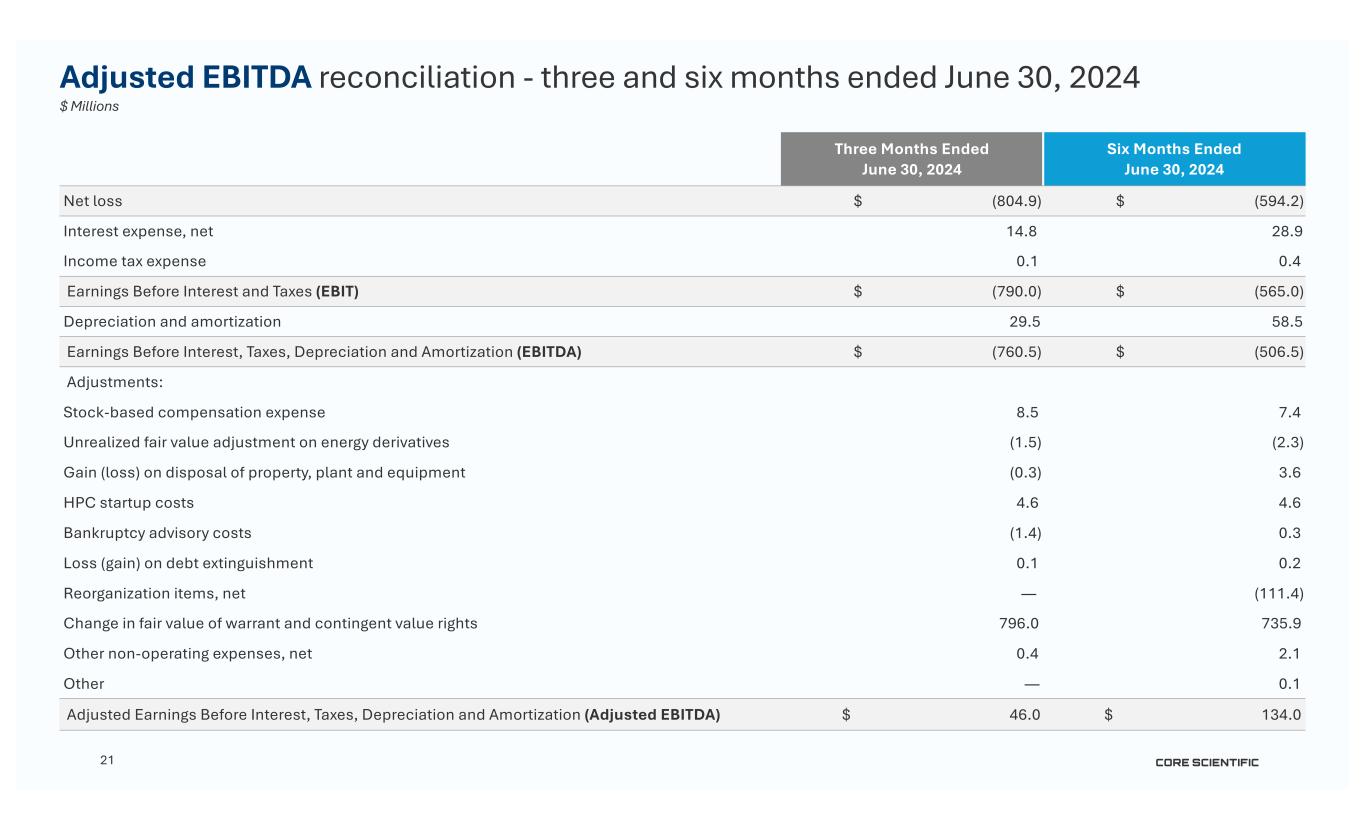
21 Adjusted EBITDA reconciliation - three and six months ended June 30, 2024 $ Millions Three Months Ended June 30, 2024 Six Months Ended June 30, 2024 Net loss $ (804.9) $ (594.2) Interest expense, net 14.8 28.9 Income tax expense 0.1 0.4 Earnings Before Interest and Taxes (EBIT) $ (790.0) $ (565.0) Depreciation and amortization 29.5 58.5 Earnings Before Interest, Taxes, Depreciation and Amortization (EBITDA) $ (760.5) $ (506.5) Adjustments: Stock-based compensation expense 8.5 7.4 Unrealized fair value adjustment on energy derivatives (1.5) (2.3) Gain (loss) on disposal of property, plant and equipment (0.3) 3.6 HPC startup costs 4.6 4.6 Bankruptcy advisory costs (1.4) 0.3 Loss (gain) on debt extinguishment 0.1 0.2 Reorganization items, net — (111.4) Change in fair value of warrant and contingent value rights 796.0 735.9 Other non-operating expenses, net 0.4 2.1 Other — 0.1 Adjusted Earnings Before Interest, Taxes, Depreciation and Amortization (Adjusted EBITDA) $ 46.0 $ 134.0
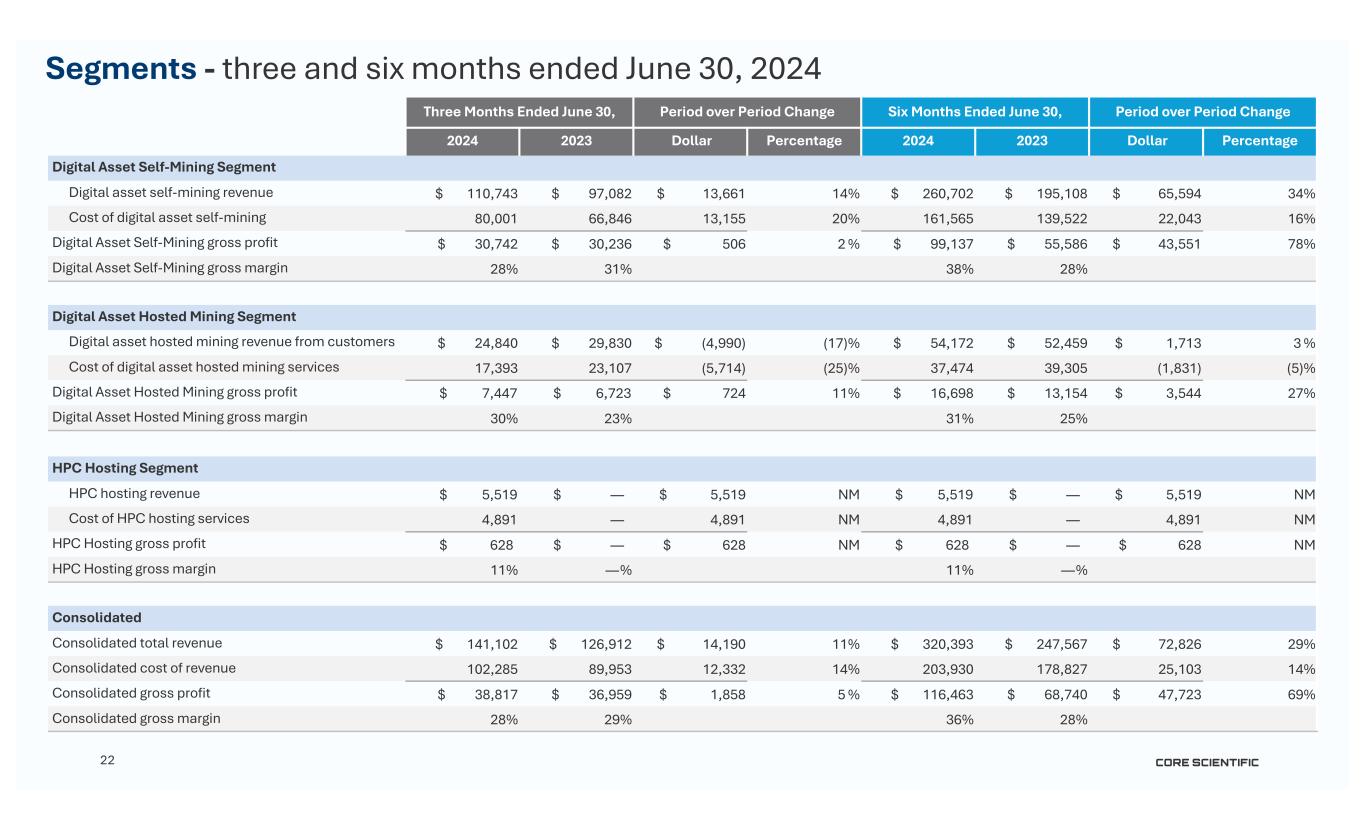
22 Three Months Ended June 30, Period over Period Change Six Months Ended June 30, Period over Period Change 2024 2023 Dollar Percentage 2024 2023 Dollar Percentage Digital Asset Self-Mining Segment Digital asset self-mining revenue $ 110,743 $ 97,082 $ 13,661 14 % $ 260,702 $ 195,108 $ 65,594 34 % Cost of digital asset self-mining 80,001 66,846 13,155 20 % 161,565 139,522 22,043 16 % Digital Asset Self-Mining gross profit $ 30,742 $ 30,236 $ 506 2 % $ 99,137 $ 55,586 $ 43,551 78 % Digital Asset Self-Mining gross margin 28 % 31 % 38 % 28 % Digital Asset Hosted Mining Segment Digital asset hosted mining revenue from customers $ 24,840 $ 29,830 $ (4,990) (17) % $ 54,172 $ 52,459 $ 1,713 3 % Cost of digital asset hosted mining services 17,393 23,107 (5,714) (25) % 37,474 39,305 (1,831) (5) % Digital Asset Hosted Mining gross profit $ 7,447 $ 6,723 $ 724 11 % $ 16,698 $ 13,154 $ 3,544 27 % Digital Asset Hosted Mining gross margin 30 % 23% 31% 25% HPC Hosting Segment HPC hosting revenue $ 5,519 $ — $ 5,519 NM $ 5,519 $ — $ 5,519 NM Cost of HPC hosting services 4,891 — 4,891 NM 4,891 — 4,891 NM HPC Hosting gross profit $ 628 $ — $ 628 NM $ 628 $ — $ 628 NM HPC Hosting gross margin 11% —% 11% —% Consolidated Consolidated total revenue $ 141,102 $ 126,912 $ 14,190 11% $ 320,393 $ 247,567 $ 72,826 29% Consolidated cost of revenue 102,285 89,953 12,332 14% 203,930 178,827 25,103 14% Consolidated gross profit $ 38,817 $ 36,959 $ 1,858 5 % $ 116,463 $ 68,740 $ 47,723 69% Consolidated gross margin 28% 29% 36% 28% Segments - three and six months ended June 30, 2024
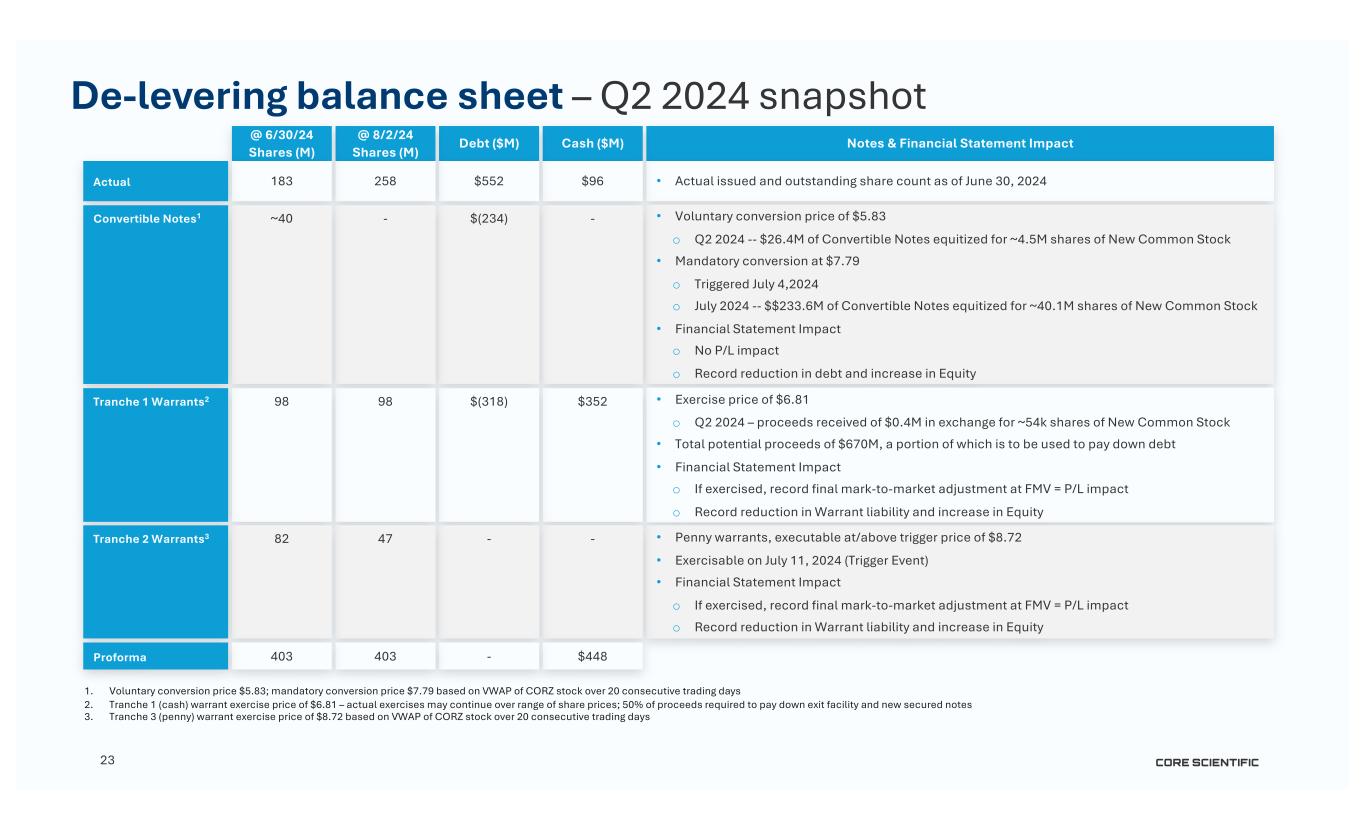
23 De-levering balance sheet – Q2 2024 snapshot 1. Voluntary conversion price $5.83; mandatory conversion price $7.79 based on VWAP of CORZ stock over 20 consecutive trading days 2. Tranche 1 (cash) warrant exercise price of $6.81 – actual exercises may continue over range of share prices; 50% of proceeds required to pay down exit facility and new secured notes 3. Tranche 3 (penny) warrant exercise price of $8.72 based on VWAP of CORZ stock over 20 consecutive trading days Notes & Financial Statement Impact • Actual issued and outstanding share count as of June 30, 2024 • Voluntary conversion price of $5.83 o Q2 2024 -- $26.4M of Convertible Notes equitized for ~4.5M shares of New Common Stock • Mandatory conversion at $7.79 o Triggered July 4,2024 o July 2024 -- $$233.6M of Convertible Notes equitized for ~40.1M shares of New Common Stock • Financial Statement Impact o No P/L impact o Record reduction in debt and increase in Equity • Exercise price of $6.81 o Q2 2024 – proceeds received of $0.4M in exchange for ~54k shares of New Common Stock • Total potential proceeds of $670M, a portion of which is to be used to pay down debt • Financial Statement Impact o If exercised, record final mark-to-market adjustment at FMV = P/L impact o Record reduction in Warrant liability and increase in Equity • Penny warrants, executable at/above trigger price of $8.72 • Exercisable on July 11, 2024 (Trigger Event) • Financial Statement Impact o If exercised, record final mark-to-market adjustment at FMV = P/L impact o Record reduction in Warrant liability and increase in Equity Cash ($M) $96 - $352 - Debt ($M) $552 $(234) $(318) - @ 8/2/24 Shares (M) 258 - 98 47 @ 6/30/24 Shares (M) 183 ~40 98 82 Actual Convertible Notes1 Tranche 1 Warrants2 Tranche 2 Warrants3 $448-403403Proforma