EX-99.2
Published on March 12, 2024
1 MAR 12, 2024 Fiscal Fourth Quarter and Full Year 2023 Earnings Presentation MARCH 12, 2024 Adam Sullivan, CEO Denise Sterling, CFO
2 MAR 12, 2024 This presentation contains “forward-looking statements” within the meaning of the “safe harbor” provisions of the Private Securities Litigation Reform Act of 1995, including but not limited to, statements regarding projections, estimates and forecasts of revenue and other financial and performance metrics, projections of market opportunity and expectations, the Company’s ability to scale and grow its business, source clean and renewable energy, the advantages and expected growth of the Company and the Company’s ability to source and retain talent. You can identify forward-looking statements by the fact that they do not relate strictly to historical or current facts. These statements may include words such as “aim,” “estimate,” “plan,” “project,” “forecast,” “goal,” “intend,” “will,” “expect,” “anticipate,” “believe,” “seek,” “target” or other similar expressions that predict or indicate future events or trends or that are not statements of historical matters. All forward looking statements are subject to risks and uncertainties that may cause actual results to differ materially, including: our ability to earn digital assets profitably and to attract customers for our hosting capabilities; our ability to maintain our competitive position as digital asset networks experience increases in total network hash rate; our ability to raise additional capital to continue our expansion efforts or other operations; our need for significant electric power and the limited availability of power resources; the potential failure in our critical systems, facilities or services we provide; the physical risks and regulatory changes relating to climate change; potential significant changes to the method of validating blockchain transactions; our vulnerability to physical security breaches, which could disrupt our operations; a potential slowdown in market and economic conditions, particularly those impacting the blockchain industry and the blockchain hosting market; the identification of material weaknesses in our internal control over financial reporting; price volatility of digital assets and bitcoin in particular; the “halving” of rewards available on the Bitcoin network, or the reduction of rewards on other networks, affecting our ability to generate revenue as our customers may not have an adequate incentive to continue mining and customers may cease mining operations altogether; the potential that insufficient awards from digital asset mining could disincentivize transaction processors from expending processing power on a particular network, which could negatively impact the utility of the network and further reduce the value of its digital assets; the requirements of our existing debt agreements for us to sell our digital assets earned from mining as they are received, preventing us from recognizing any gain from appreciation in the value of the digital assets we hold; potential changes in the interpretive positions of the SEC or its staff with respect to digital asset mining firms; the increasing likelihood that U.S. federal and state legislatures and regulatory agencies will enact laws and regulations to regulate digital assets and digital asset intermediaries; increasing scrutiny and changing expectations with respect to our ESG policies; the effectiveness of our compliance and risk management methods; the adequacy of our sources of recovery if the digital assets held by us are lost, stolen or destroyed due to third-party digital asset services; the effects of our emergence from bankruptcy on our financial results, business and business relationships; and our substantial level of indebtedness and our current liquidity constraints affecting our financial condition and ability to service our indebtedness. Any such forward-looking statements represent management’s estimates and beliefs as of the date of this presentation. While we may elect to update such forward-looking statements at some point in the future, we disclaim any obligation to do so, even if subsequent events cause our views to change. Year over year comparisons are based on the combined results of Core Scientific and its acquired entities. Although the Company believes that in making such forward-looking statements its expectations are based upon reasonable assumptions, such statements may be influenced by factors that could cause actual outcomes and results to be materially different from those projected. The Company cannot assure you that the assumptions upon which these statements are based will prove to have been correct. Additional important factors that may affect the Company’s business, results of operations and financial position are described from time to time in the Company’s Annual Report on Form 10-K for the year ended December 31, 2023, Quarterly Reports on Form 10-Q and the Company’s other filings with the Securities and Exchange Commission. The Company does not undertake any obligation to update or revise any forward-looking statement, whether as a result of new information, future events or otherwise, except as may be required by applicable law. Non-GAAP Financial Measures This presentation also contains non-GAAP financial measures as defined by the SEC rules, including Adjusted EBITDA and adjusted earnings (loss) per diluted share. The Company believes that these non- GAAP measures of financial results provide useful information to management and investors regarding certain financial and business trends relating to the Company's financial condition and results of operations. The Company's management uses certain of these non-GAAP measures to compare the Company's performance to that of prior periods for trend analyses and for budgeting and planning purposes. The Company urges investors not to rely on any single financial measure to evaluate its business. Forward-looking statements
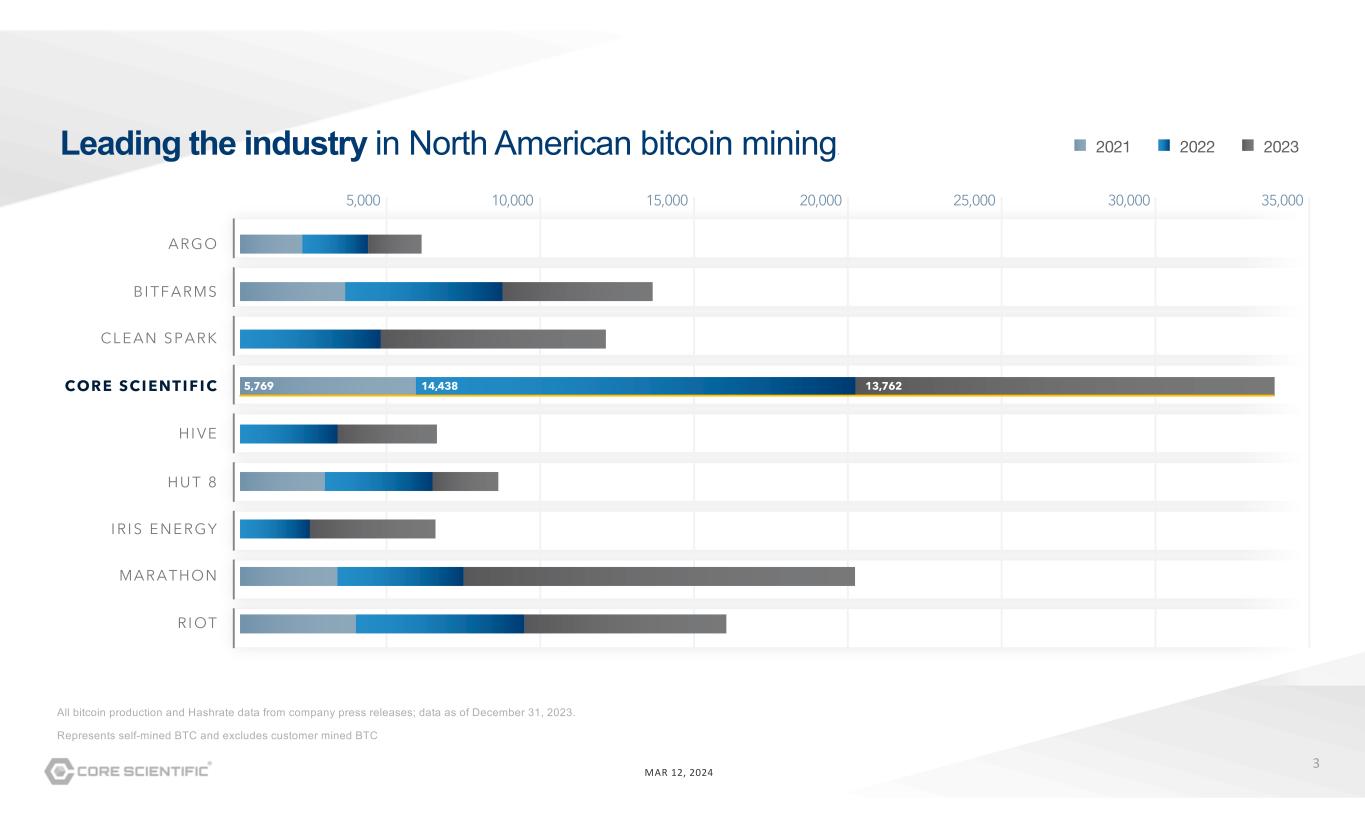
3 MAR 12, 2024 2,045 2,157 1,760 3,452 5,168 4,928 4,621 7,391 3,260 3,205 2,786 3,536 2,295 4,123 3,197 4,143 12,852 3,806 5,536 6,626 2,159 Leading the industry in North American bitcoin mining. All bitcoin production and Hashrate data from company press releases; data as of December 31, 2023. Represents self-mined BTC and excludes customer mined BTC RI OT MARATHON I RI S ENERGY HUT 8 HI VE CL EAN SPARK BI TFARMS ARGO 5,000 10,000 15,000 20,000 25,000 30,000 35,000 2021 2022 2023 5,769 14,438 13,762CORE SCI ENTI FI C
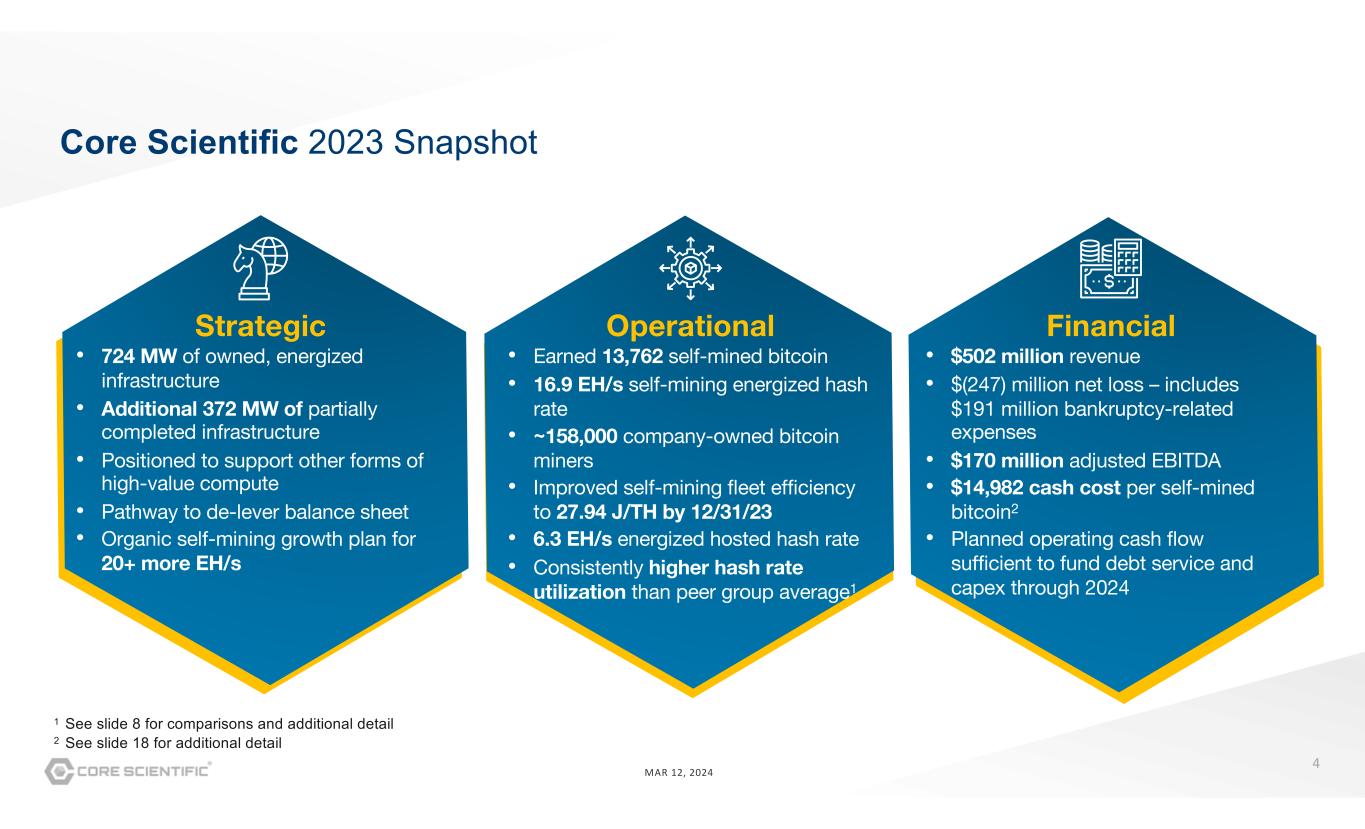
4 MAR 12, 2024 Core Scientific 2023 Snapshot Strategic • 724 MW of owned, energized infrastructure • Additional 372 MW of partially completed infrastructure • Positioned to support other forms of high-value compute • Pathway to de-lever balance sheet • Organic self-mining growth plan for 20+ more EH/s Operational • Earned 13,762 self-mined bitcoin • 16.9 EH/s self-mining energized hash rate • ~158,000 company-owned bitcoin miners • Improved self-mining fleet efficiency to 27.94 J/TH by 12/31/23 • 6.3 EH/s energized hosted hash rate • Consistently higher hash rate utilization than peer group average1 Financial • $502 million revenue • $(247) million net loss – includes $191 million bankruptcy-related expenses • $170 million adjusted EBITDA • $14,982 cash cost per self-mined bitcoin2 • Planned operating cash flow sufficient to fund debt service and capex through 2024 1 See slide 8 for comparisons and additional detail 2 See slide 18 for additional detail
5 MAR 12, 2024MAR 12, 2024 Core Scientific transforms energy into high- value compute with superior efficiency at scale
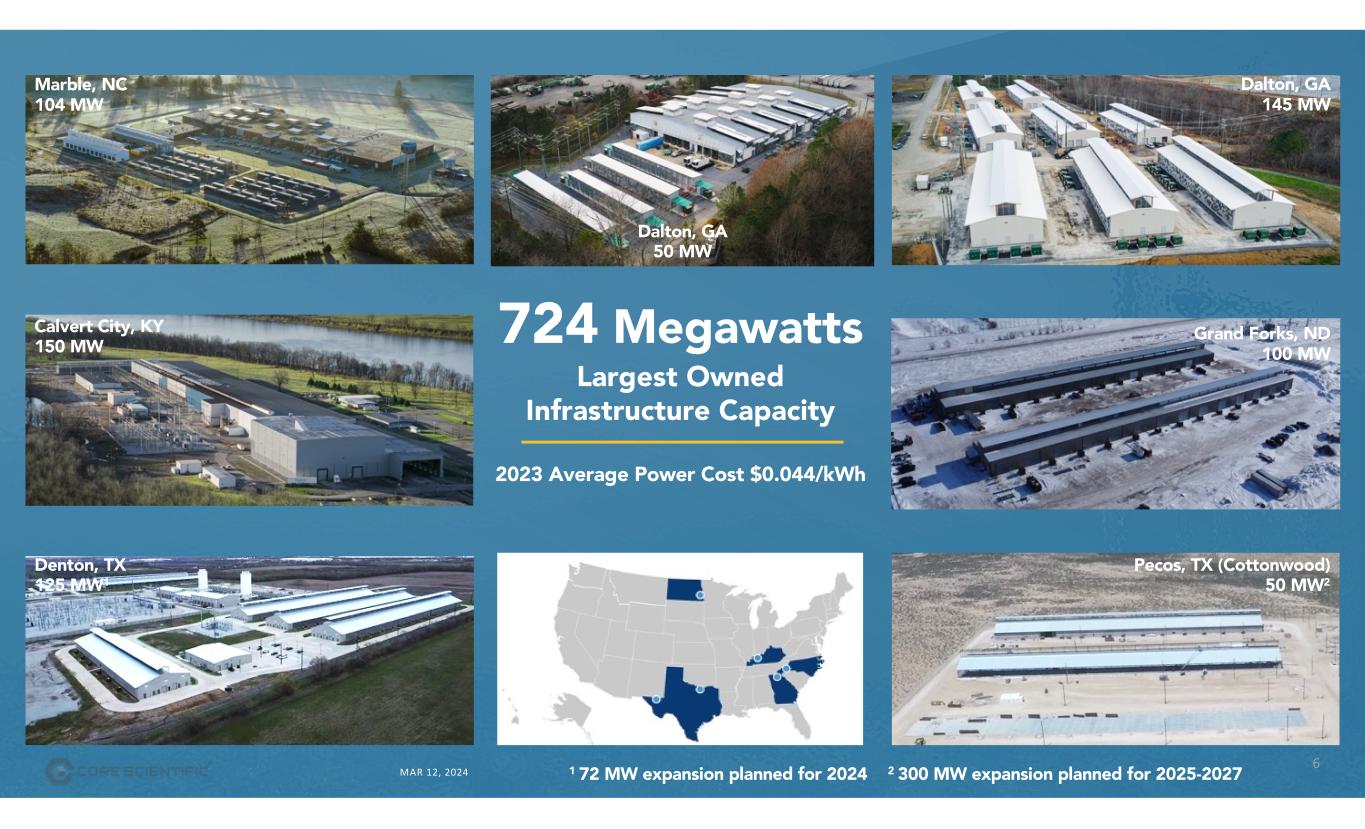
6 MAR 12, 2024MAR 12, 2024 Denton, TX 125 MW1 Calvert City, KY 150 MW Dalton, GA 145 MW Marble, NC 104 MW Pecos, TX (Cottonwood) 50 MW2 Grand Forks, ND 100 MW 724 Megawatts Largest Owned Infrastructure Capacity 2023 Average Power Cost $0.044/kWh Dalton, GA 50 MW 1 72 MW expansion planned for 2024 2 300 MW expansion planned for 2025-2027
7 MAR 12, 2024 Restructuring positioned Core Scientific for success Stronger balance sheet & pathway to de-lever further Improved hosting business performance, fewer customers, better margin Rigor and discipline in capital allocation, organic growth funded from operating cashflow Reduced operating expenses, implemented hedging strategy on power to manage downside risk Positioned Company for successful emergence, paid off DIP financing, over- subscribed Equity Rights Offering
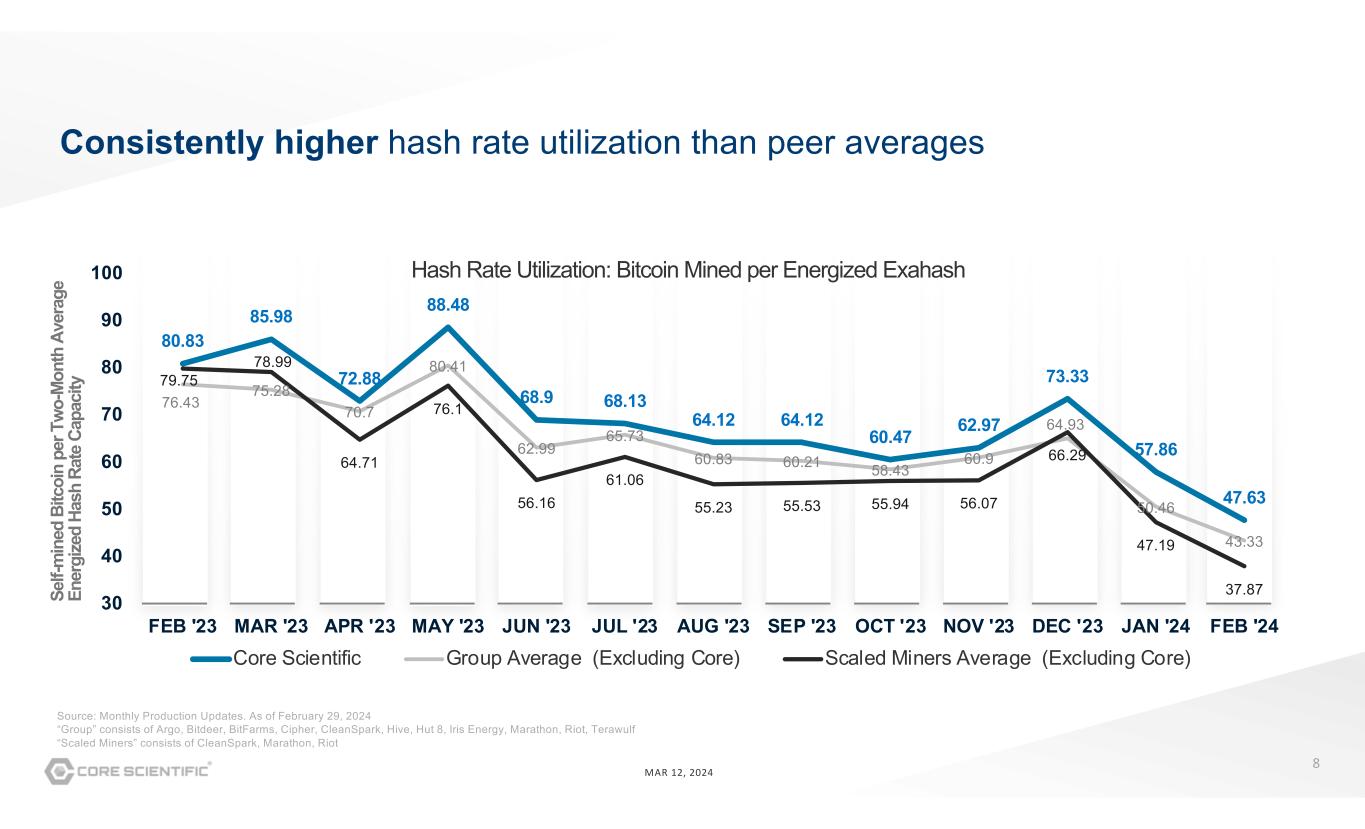
8 MAR 12, 2024 Source: Monthly Production Updates. As of February 29, 2024 “Group” consists of Argo, Bitdeer, BitFarms, Cipher, CleanSpark, Hive, Hut 8, Iris Energy, Marathon, Riot, Terawulf “Scaled Miners” consists of CleanSpark, Marathon, Riot Se lf- m in ed B itc oi n pe r T wo -M on th A ve ra ge En er gi ze d Ha sh R at e Ca pa ci ty 80.83 85.98 72.88 88.48 68.9 68.13 64.12 64.12 60.47 62.97 73.33 57.86 47.63 76.43 75.28 70.7 80.41 62.99 65.73 60.83 60.21 58.43 60.9 64.93 50.46 43.33 79.75 78.99 64.71 76.1 56.16 61.06 55.23 55.53 55.94 56.07 66.29 47.19 37.87 30 40 50 60 70 80 90 100 FEB '23 MAR '23 APR '23 MAY '23 JUN '23 JUL '23 AUG '23 SEP '23 OCT '23 NOV '23 DEC '23 JAN '24 FEB '24 Hash Rate Utilization: Bitcoin Mined per Energized Exahash Core Scientific Group Average (Excluding Core) Scaled Miners Average (Excluding Core) Consistently higher hash rate utilization than peer averages
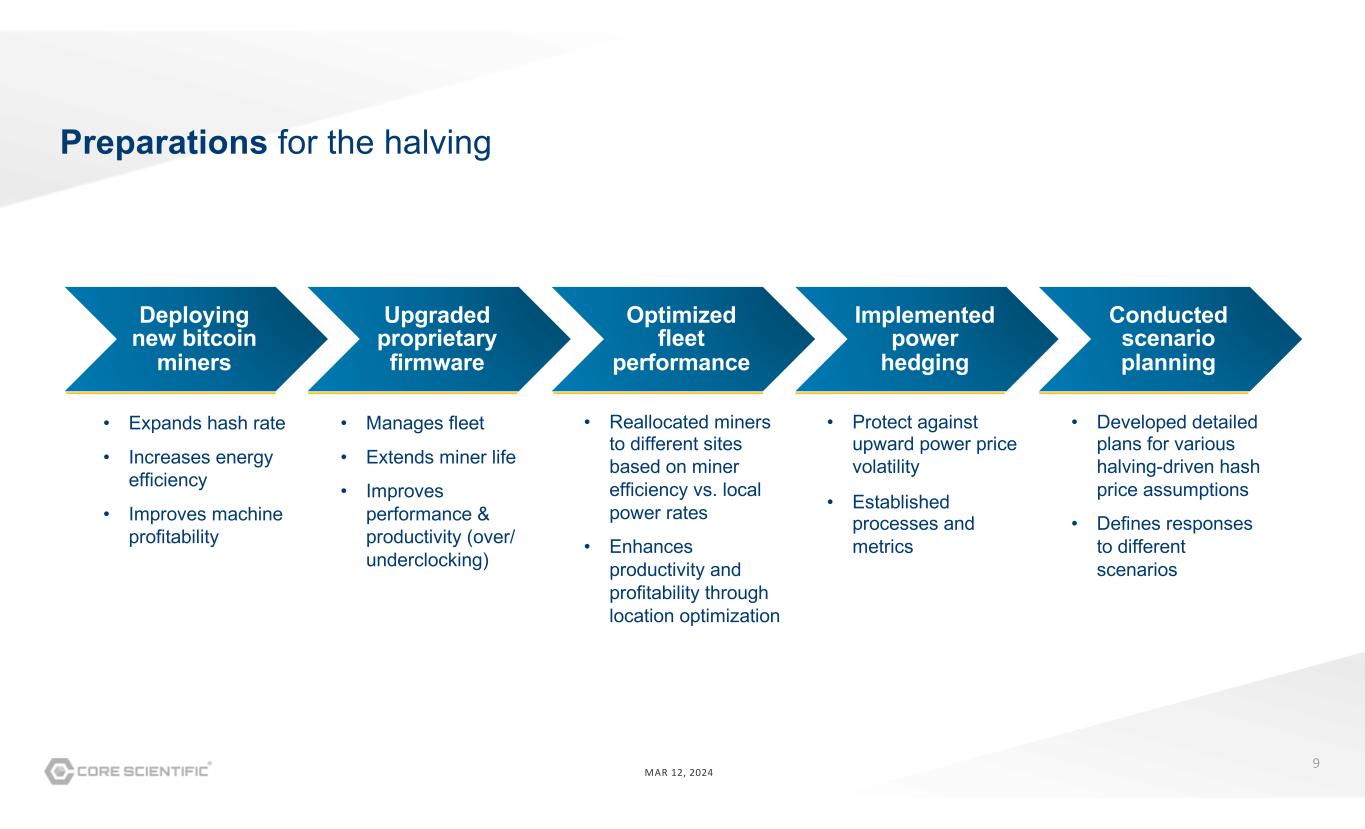
9 MAR 12, 2024 Deploying new bitcoin miners Upgraded proprietary firmware Optimized fleet performance Implemented power hedging Conducted scenario planning Preparations for the halving • Expands hash rate • Increases energy efficiency • Improves machine profitability • Manages fleet • Extends miner life • Improves performance & productivity (over/ underclocking) • Reallocated miners to different sites based on miner efficiency vs. local power rates • Enhances productivity and profitability through location optimization • Protect against upward power price volatility • Established processes and metrics • Developed detailed plans for various halving-driven hash price assumptions • Defines responses to different scenarios
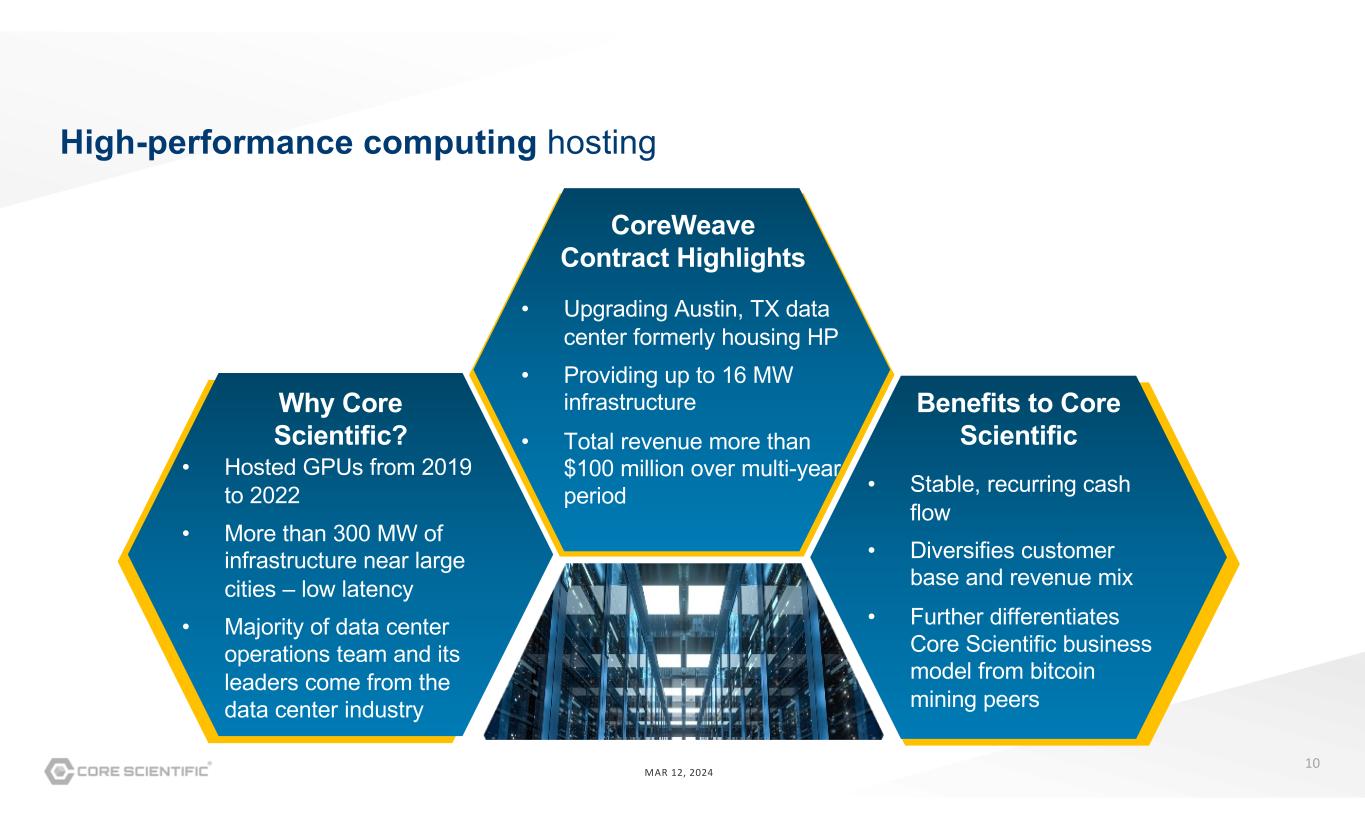
10 MAR 12, 2024 High-performance computing hosting Why Core Scientific? Benefits to Core Scientific CoreWeave Contract Highlights • Hosted GPUs from 2019 to 2022 • More than 300 MW of infrastructure near large cities – low latency • Majority of data center operations team and its leaders come from the data center industry • Upgrading Austin, TX data center formerly housing HP • Providing up to 16 MW infrastructure • Total revenue more than $100 million over multi-year period • Stable, recurring cash flow • Diversifies customer base and revenue mix • Further differentiates Core Scientific business model from bitcoin mining peers
11 MAR 12, 2024 Financial summary
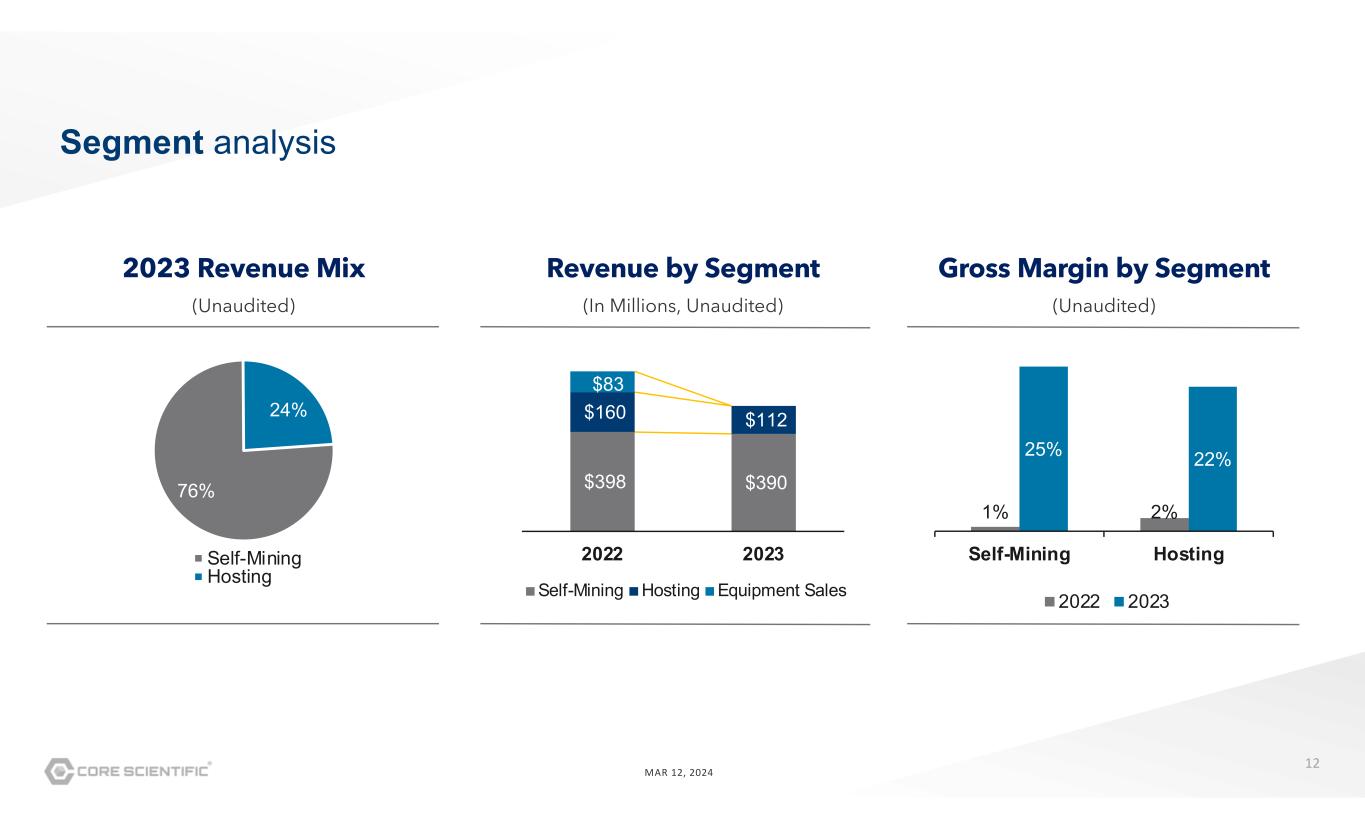
12 MAR 12, 2024 (Unaudited) 2023 Revenue Mix (In Millions, Unaudited) Revenue by Segment Segment analysis 76% 24% Self-Mining Hosting $398 $390 $160 $112 $83 2022 2023 Self-Mining Hosting Equipment Sales (Unaudited) Gross Margin by Segment 1% 2% 25% 22% Self-Mining Hosting 2022 2023
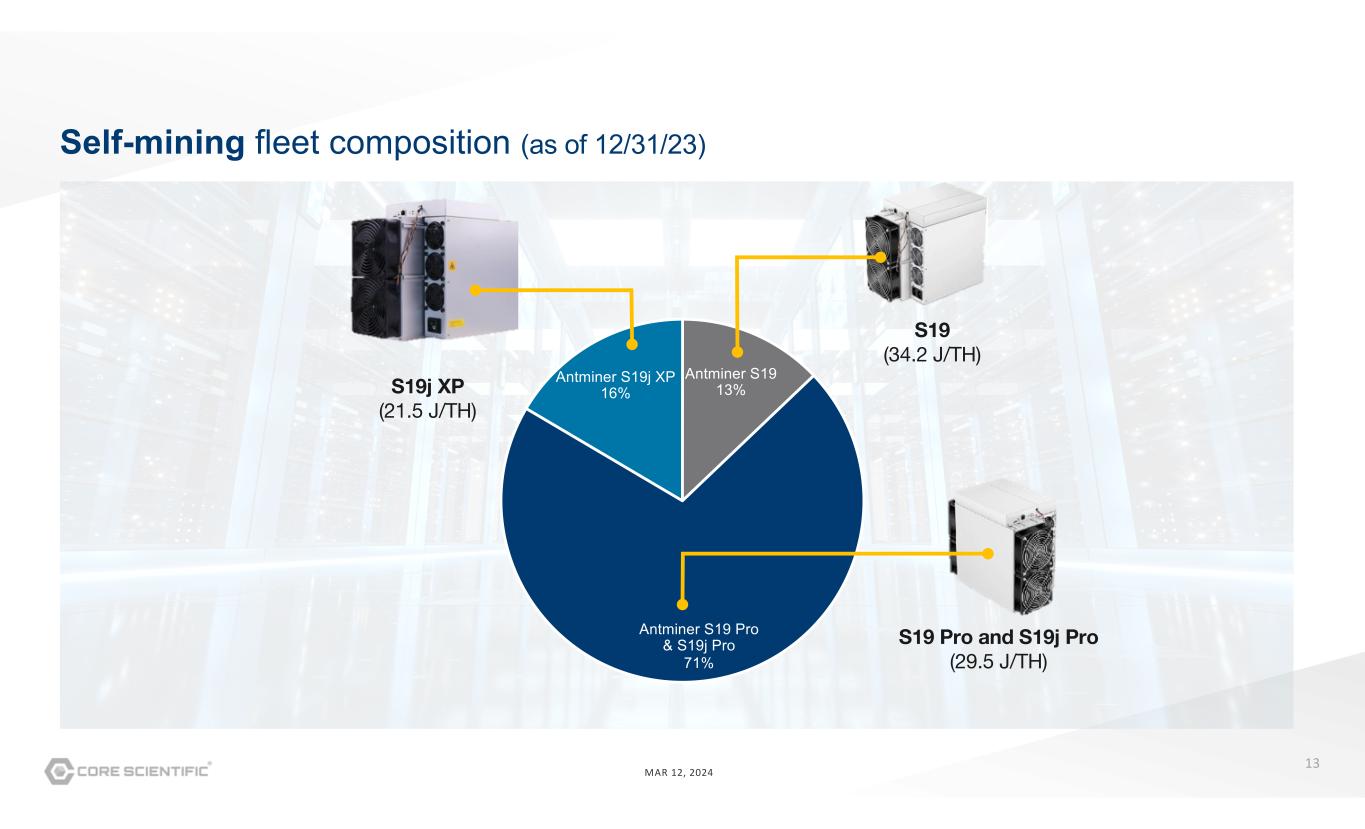
13 MAR 12, 2024 Self-mining fleet composition (as of 12/31/23) Antminer S19 13% Antminer S19 Pro & S19j Pro 71% Antminer S19j XP 16%S19j XP (21.5 J/TH) S19 (34.2 J/TH) S19 Pro and S19j Pro (29.5 J/TH)
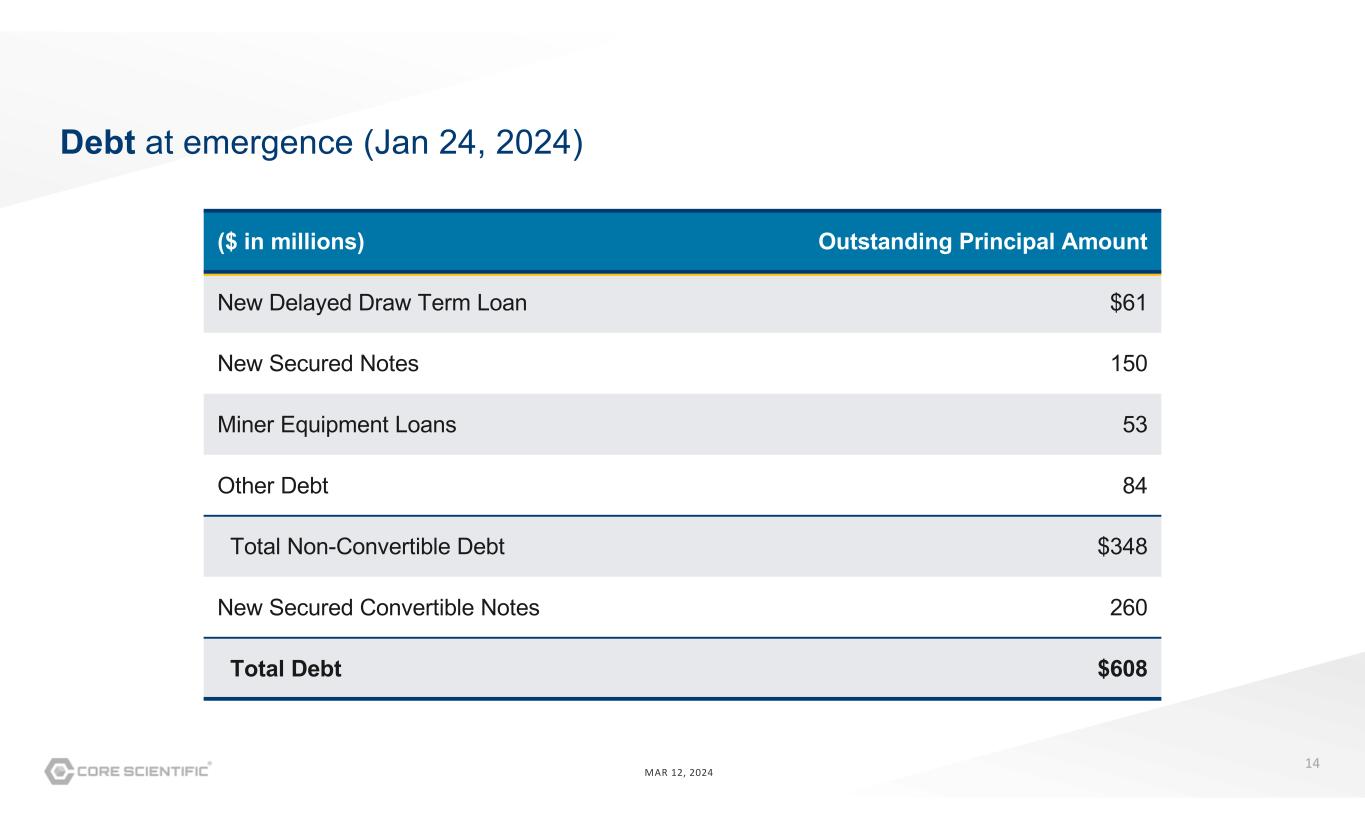
14 MAR 12, 2024 Debt at emergence (Jan 24, 2024) ($ in millions) Outstanding Principal Amount New Delayed Draw Term Loan $61 New Secured Notes 150 Miner Equipment Loans 53 Other Debt 84 Total Non-Convertible Debt $348 New Secured Convertible Notes 260 Total Debt $608
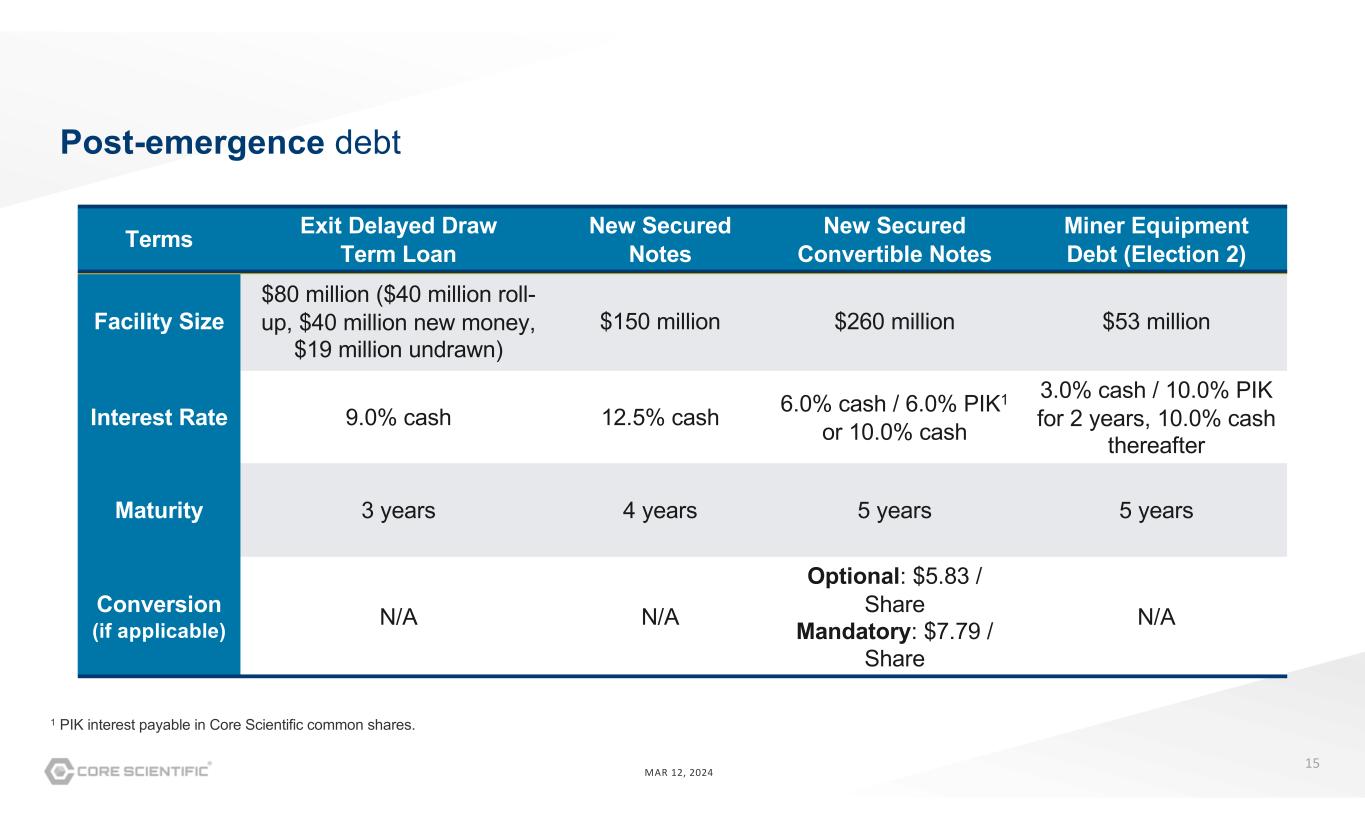
15 MAR 12, 2024 Post-emergence debt Terms Exit Delayed Draw Term Loan New Secured Notes New Secured Convertible Notes Miner Equipment Debt (Election 2) Facility Size $80 million ($40 million roll- up, $40 million new money, $19 million undrawn) $150 million $260 million $53 million Interest Rate 9.0% cash 12.5% cash 6.0% cash / 6.0% PIK1 or 10.0% cash 3.0% cash / 10.0% PIK for 2 years, 10.0% cash thereafter Maturity 3 years 4 years 5 years 5 years Conversion (if applicable) N/A N/A Optional: $5.83 / Share Mandatory: $7.79 / Share N/A 1 PIK interest payable in Core Scientific common shares.
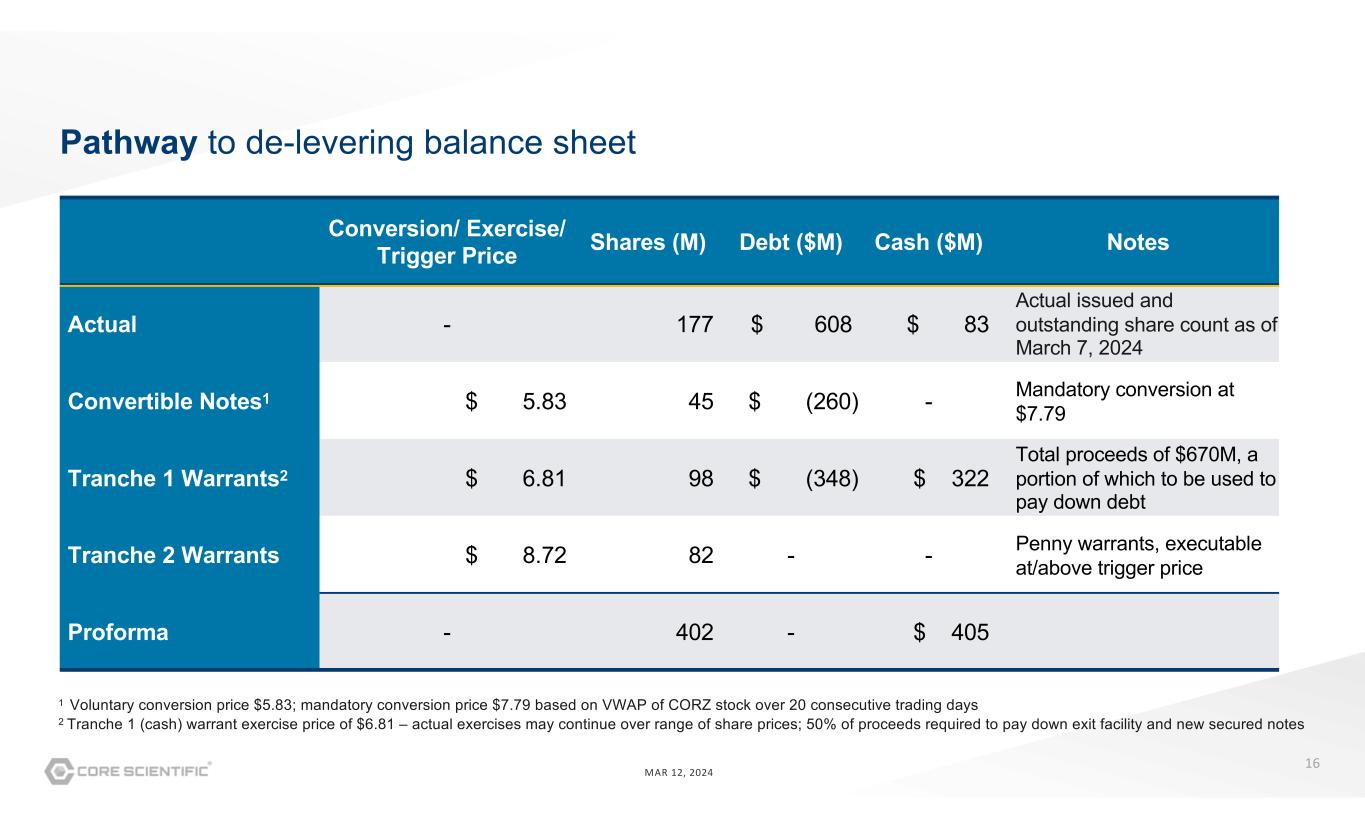
16 MAR 12, 2024 Pathway to de-levering balance sheet Conversion/ Exercise/ Trigger Price Shares (M) Debt ($M) Cash ($M) Notes Actual - 177 $ 608 $ 83 Actual issued and outstanding share count as of March 7, 2024 Convertible Notes1 $ 5.83 45 $ (260) - Mandatory conversion at $7.79 Tranche 1 Warrants2 $ 6.81 98 $ (348) $ 322 Total proceeds of $670M, a portion of which to be used to pay down debt Tranche 2 Warrants $ 8.72 82 - - Penny warrants, executable at/above trigger price Proforma - 402 - $ 405 1 Voluntary conversion price $5.83; mandatory conversion price $7.79 based on VWAP of CORZ stock over 20 consecutive trading days 2 Tranche 1 (cash) warrant exercise price of $6.81 – actual exercises may continue over range of share prices; 50% of proceeds required to pay down exit facility and new secured notes
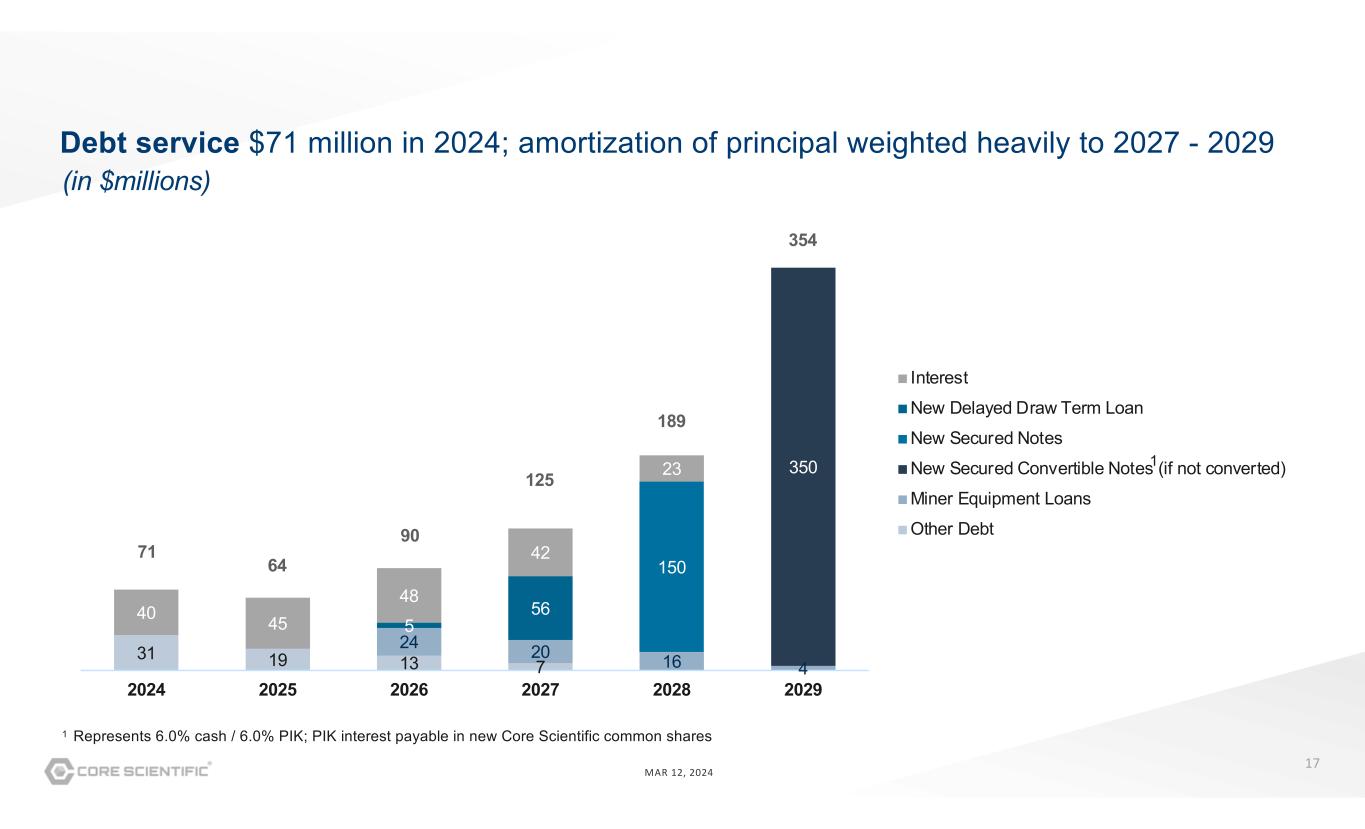
17 MAR 12, 2024 31 19 13 7 24 20 16 4 350 150 5 5640 45 48 42 23 2024 2025 2026 2027 2028 2029 Interest New Delayed Draw Term Loan New Secured Notes New Secured Convertible Notes (if not converted) Miner Equipment Loans Other Debt Debt service $71 million in 2024; amortization of principal weighted heavily to 2027 - 2029 71 64 90 125 189 354 (in $millions) 1 Represents 6.0% cash / 6.0% PIK; PIK interest payable in new Core Scientific common shares 1
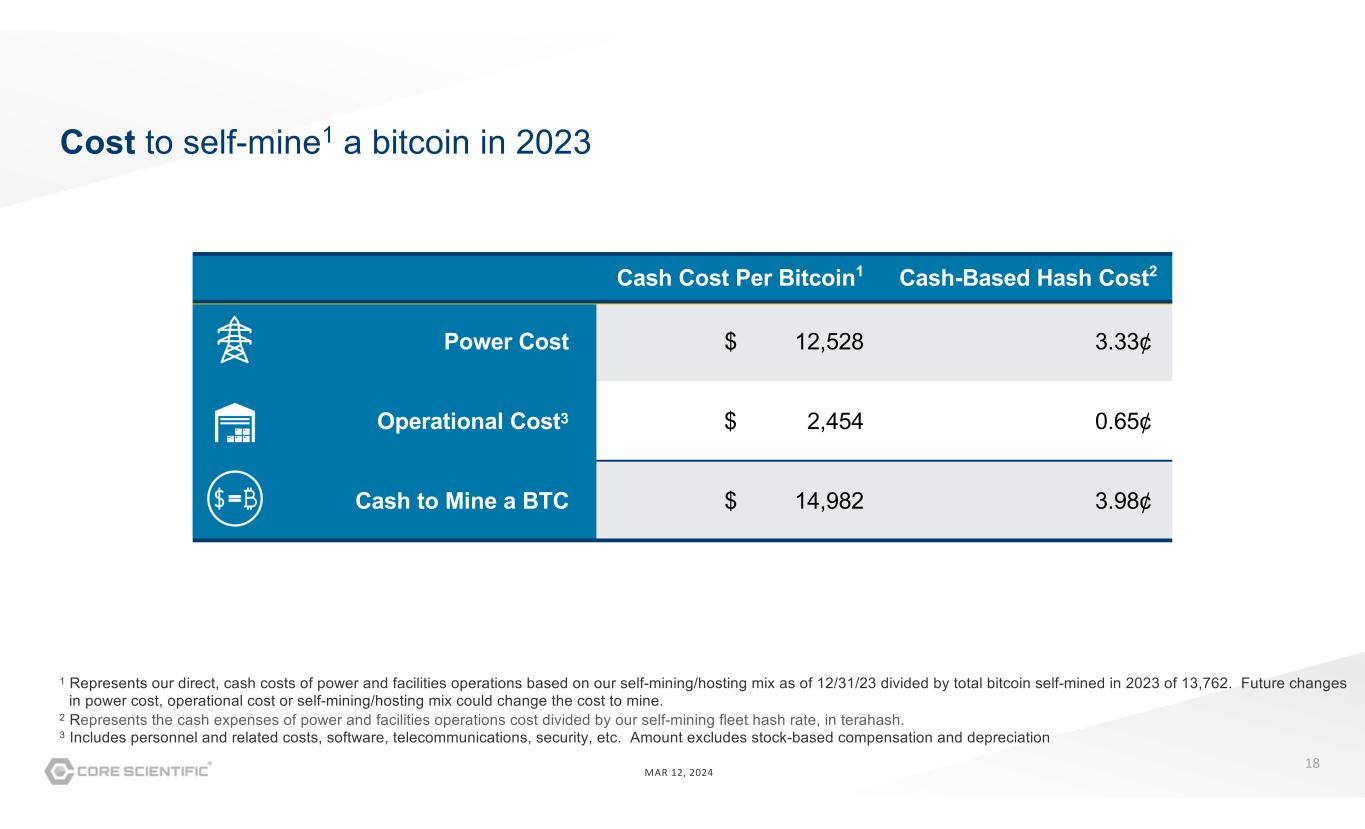
18 MAR 12, 2024 Cash Cost Per Bitcoin1 Cash-Based Hash Cost2 Power Cost $ 12,528 3.33¢ Operational Cost3 $ 2,454 0.65¢ Cash to Mine a BTC $ 14,982 3.98¢ 1 Represents our direct, cash costs of power and facilities operations based on our self-mining/hosting mix as of 12/31/23 divided by total bitcoin self-mined in 2023 of 13,762. Future changes in power cost, operational cost or self-mining/hosting mix could change the cost to mine. 2 Represents the cash expenses of power and facilities operations cost divided by our self-mining fleet hash rate, in terahash. 3 Includes personnel and related costs, software, telecommunications, security, etc. Amount excludes stock-based compensation and depreciation Cost to self-mine1 a bitcoin in 2023
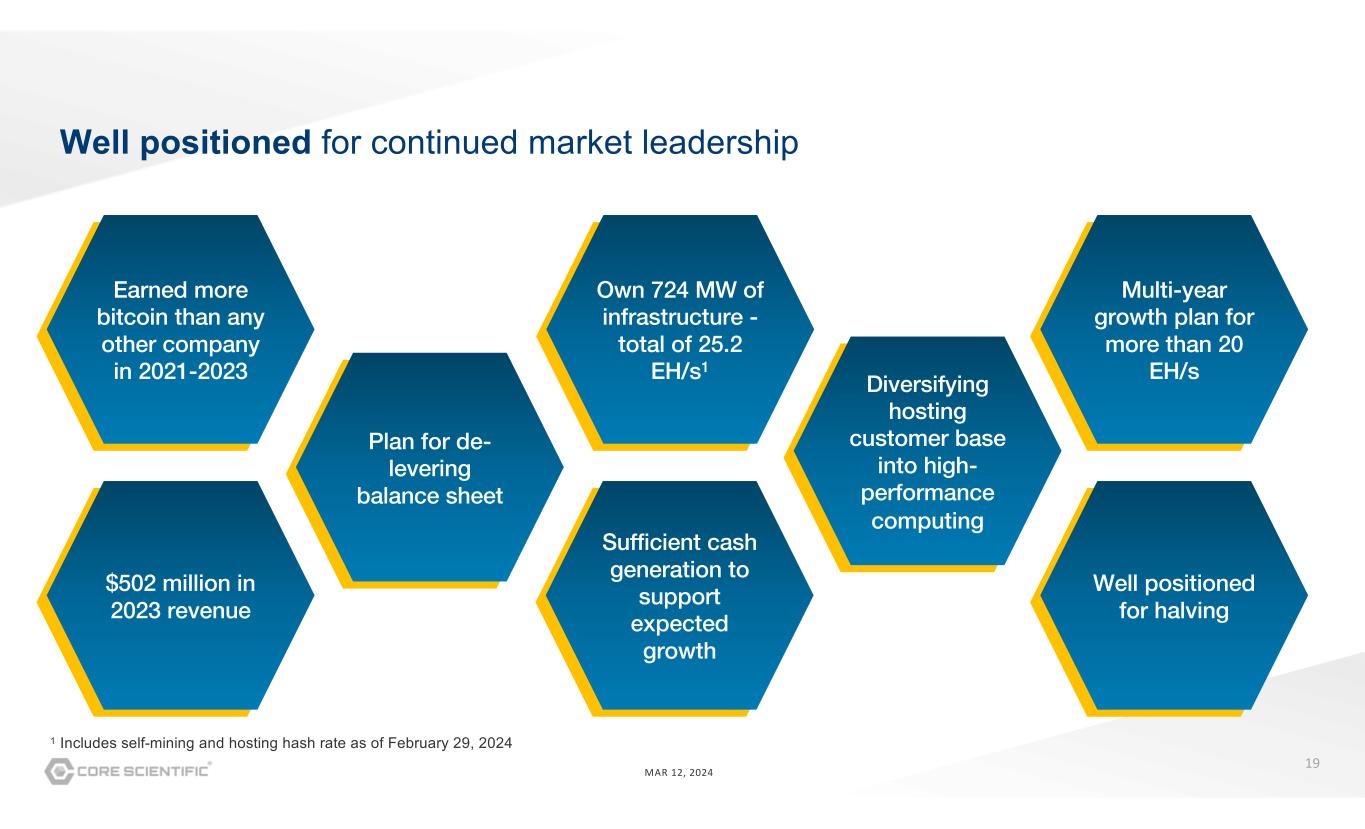
19 MAR 12, 2024 Well positioned for continued market leadership Earned more bitcoin than any other company in 2021-2023 $502 million in 2023 revenue Own 724 MW of infrastructure - total of 25.2 EH/s1 Diversifying hosting customer base into high- performance computing Well positioned for halving Plan for de- levering balance sheet Sufficient cash generation to support expected growth Multi-year growth plan for more than 20 EH/s 1 Includes self-mining and hosting hash rate as of February 29, 2024

Thank you! Investor Relations (737) 931-1351 ir@corescientific.com Corescientific.com Leader in bitcoin mining and digital infrastructure for emerging high- value compute
21 MAR 12, 2024 Appendix
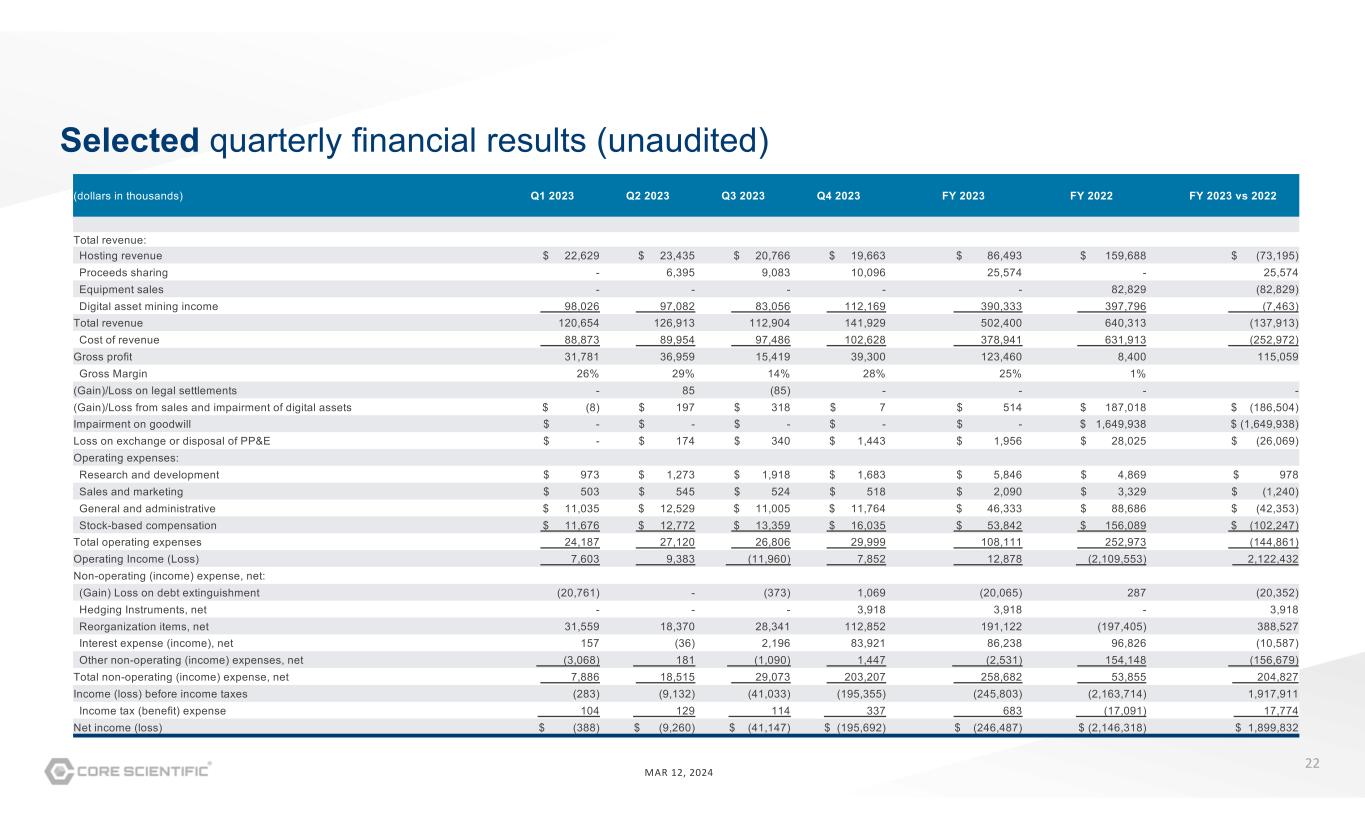
22 MAR 12, 2024 Selected quarterly financial results (unaudited) (dollars in thousands) Q1 2023 Q2 2023 Q3 2023 Q4 2023 FY 2023 FY 2022 FY 2023 vs 2022 Total revenue: Hosting revenue $ 22,629 $ 23,435 $ 20,766 $ 19,663 $ 86,493 $ 159,688 $ (73,195) Proceeds sharing - 6,395 9,083 10,096 25,574 - 25,574 Equipment sales - - - - - 82,829 (82,829) Digital asset mining income 98,026 97,082 83,056 112,169 390,333 397,796 (7,463) Total revenue 120,654 126,913 112,904 141,929 502,400 640,313 (137,913) Cost of revenue 88,873 89,954 97,486 102,628 378,941 631,913 (252,972) Gross profit 31,781 36,959 15,419 39,300 123,460 8,400 115,059 Gross Margin 26% 29% 14% 28% 25% 1% (Gain)/Loss on legal settlements - 85 (85) - - - - (Gain)/Loss from sales and impairment of digital assets $ (8) $ 197 $ 318 $ 7 $ 514 $ 187,018 $ (186,504) Impairment on goodwill $ - $ - $ - $ - $ - $ 1,649,938 $ (1,649,938) Loss on exchange or disposal of PP&E $ - $ 174 $ 340 $ 1,443 $ 1,956 $ 28,025 $ (26,069) Operating expenses: Research and development $ 973 $ 1,273 $ 1,918 $ 1,683 $ 5,846 $ 4,869 $ 978 Sales and marketing $ 503 $ 545 $ 524 $ 518 $ 2,090 $ 3,329 $ (1,240) General and administrative $ 11,035 $ 12,529 $ 11,005 $ 11,764 $ 46,333 $ 88,686 $ (42,353) Stock-based compensation $ 11,676 $ 12,772 $ 13,359 $ 16,035 $ 53,842 $ 156,089 $ (102,247) Total operating expenses 24,187 27,120 26,806 29,999 108,111 252,973 (144,861) Operating Income (Loss) 7,603 9,383 (11,960) 7,852 12,878 (2,109,553) 2,122,432 Non-operating (income) expense, net: (Gain) Loss on debt extinguishment (20,761) - (373) 1,069 (20,065) 287 (20,352) Hedging Instruments, net - - - 3,918 3,918 - 3,918 Reorganization items, net 31,559 18,370 28,341 112,852 191,122 (197,405) 388,527 Interest expense (income), net 157 (36) 2,196 83,921 86,238 96,826 (10,587) Other non-operating (income) expenses, net (3,068) 181 (1,090) 1,447 (2,531) 154,148 (156,679) Total non-operating (income) expense, net 7,886 18,515 29,073 203,207 258,682 53,855 204,827 Income (loss) before income taxes (283) (9,132) (41,033) (195,355) (245,803) (2,163,714) 1,917,911 Income tax (benefit) expense 104 129 114 337 683 (17,091) 17,774 Net income (loss) $ (388) $ (9,260) $ (41,147) $ (195,692) $ (246,487) $ (2,146,318) $ 1,899,832
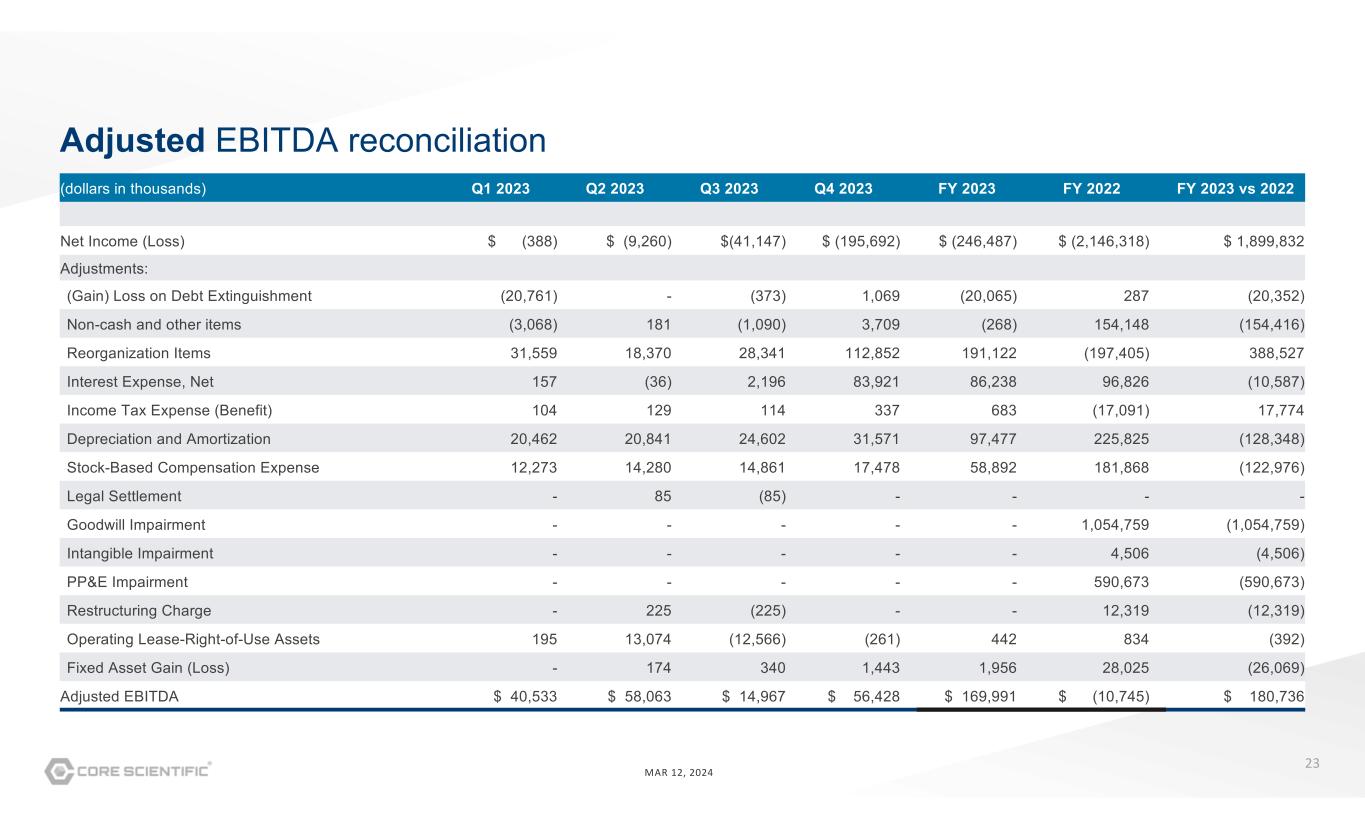
23 MAR 12, 2024 Adjusted EBITDA reconciliation (dollars in thousands) Q1 2023 Q2 2023 Q3 2023 Q4 2023 FY 2023 FY 2022 FY 2023 vs 2022 Net Income (Loss) $ (388) $ (9,260) $(41,147) $ (195,692) $ (246,487) $ (2,146,318) $ 1,899,832 Adjustments: (Gain) Loss on Debt Extinguishment (20,761) - (373) 1,069 (20,065) 287 (20,352) Non-cash and other items (3,068) 181 (1,090) 3,709 (268) 154,148 (154,416) Reorganization Items 31,559 18,370 28,341 112,852 191,122 (197,405) 388,527 Interest Expense, Net 157 (36) 2,196 83,921 86,238 96,826 (10,587) Income Tax Expense (Benefit) 104 129 114 337 683 (17,091) 17,774 Depreciation and Amortization 20,462 20,841 24,602 31,571 97,477 225,825 (128,348) Stock-Based Compensation Expense 12,273 14,280 14,861 17,478 58,892 181,868 (122,976) Legal Settlement - 85 (85) - - - - Goodwill Impairment - - - - - 1,054,759 (1,054,759) Intangible Impairment - - - - - 4,506 (4,506) PP&E Impairment - - - - - 590,673 (590,673) Restructuring Charge - 225 (225) - - 12,319 (12,319) Operating Lease-Right-of-Use Assets 195 13,074 (12,566) (261) 442 834 (392) Fixed Asset Gain (Loss) - 174 340 1,443 1,956 28,025 (26,069) Adjusted EBITDA $ 40,533 $ 58,063 $ 14,967 $ 56,428 $ 169,991 $ (10,745) $ 180,736