EX-99.2
Published on March 29, 2022
Exhibit 99.2 Fiscal Year 2021 Earnings Presentation March 29, 2022
Legal Disclaimer Forward-LookingStatements This presentation includes “forward-looking statements'' within the meaning of the “safe harbor” provisions of the United States Private Securities Litigation Reform Act of 1995. Forward-looking statements may be identified by the use of words such as “estimate,” “plan,” “project,” “forecast,” “intend,” “will,” “expect,” “anticipate,” “believe,” “seek,” “target” or other similar expressions that predict or indicate future events or trends or that are not statements of historical matters. These forward-looking statements include, but are not limited to, those related to the Company’s ability to scale and grow its business, source clean and renewable energy, the advantages and expected growth of the Company, future estimates of revenue, net income and adjusted EBITDA, future estimates of computing capacity and operating power, future demand for hosting capacity, future estimate of hashrate (including mix of self-mining and hosting), operating gigawatts and power, future projects in construction or negotiation and future expectations of operation location, orders for miners and critical infrastructure, future estimates of self-mining capacity, the public float of the Company’s shares, future infrastructure additions and their operational capacity, and operating power and site features of the Company’s operations center in Denton, Texas. These statements are provided for illustrative purposes only and are based on various assumptions and on the current expectations of the Company’s management. These forward-looking statements are not intended to serve, and must not be relied on by any investor, as a guarantee, an assurance, a prediction or a definitive statement of fact or probability. Actual events and circumstances are difficult or impossible to predict and will differ from assumptions. Many actual events and circumstances are beyond the control of the Company. These forward-looking statements are subject to a number of risks and uncertainties, including those identified in the Company’s reports filed with the U.S. Securities and Exchange Commission (”SEC”) from time to time, including the Company’s definitive proxy statement filed with the SEC on January 3, 2022, and other subsequent filings the Company files with the SEC from time to time, including its Annual Report on Form 10-K for the year ended December 31, 2021 and Current Report on Form 8-K filed on January 24, 2022. If any of these risks materialize or our assumptions prove incorrect, actual results could differ materially from the results implied by these forward-looking statements. Accordingly, undue reliance should not be placed upon the forward-looking statements. Except as required by law, the Company assumes no obligation to update these forward-looking statements publicly, or to update the reasons actual results could differ materially from those anticipated in the forward-looking statements, even if new information becomes available in the future. Year over year comparisons are based on the combined results of Core Scientific and its acquired entities. Non-GAAP FinancialMeasures This presentation also contains non-GAAP financial measures as defined by the SEC rules, including Adjusted EBITDA. The Company believes that these non-GAAP measures of financial results provide useful information to management and investors regarding certain financial and business trends relating to the Company's financial condition and results of operations. The Company's management uses certain of these non-GAAP measures to compare the Company's performance to that of prior periods for trend analyses and for budgeting and planning purposes. The Company urges investors not to rely on any single financial measure to evaluate its business. MARCH 29, 2022 2
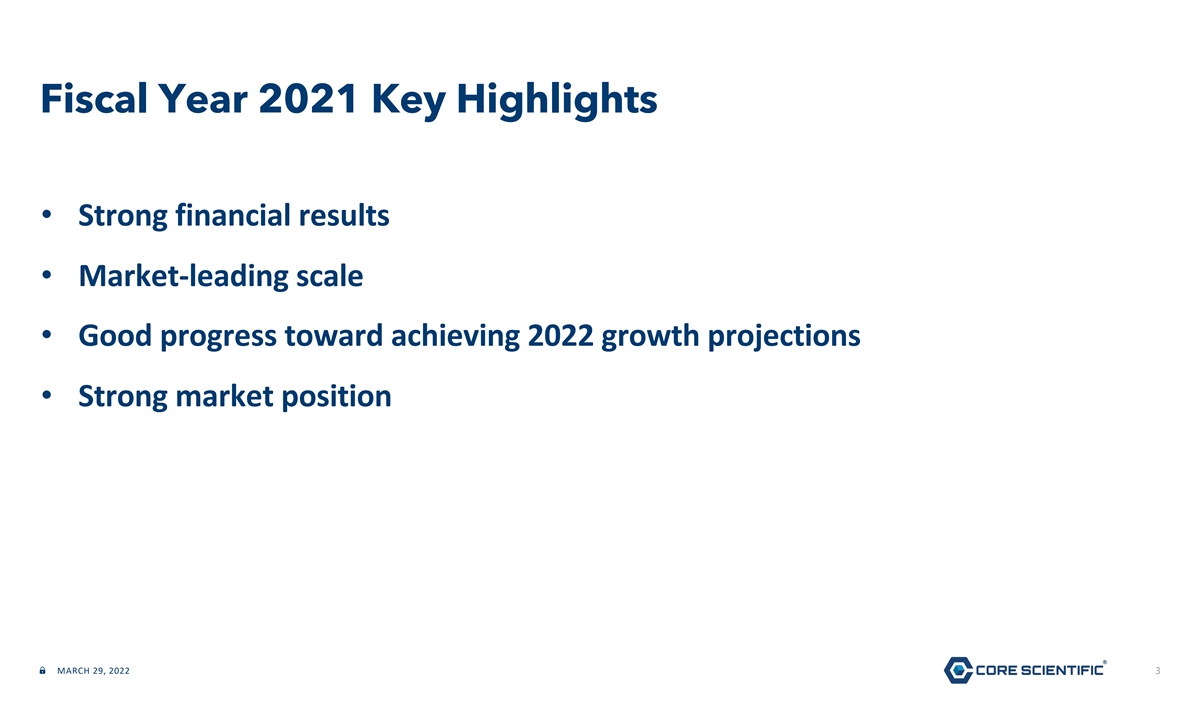
Fiscal Year 2021 Key Highlights • Strong financial results • Market-leading scale • Good progress toward achieving 2022 growth projections • Strong market position MARCH 29, 2022 3
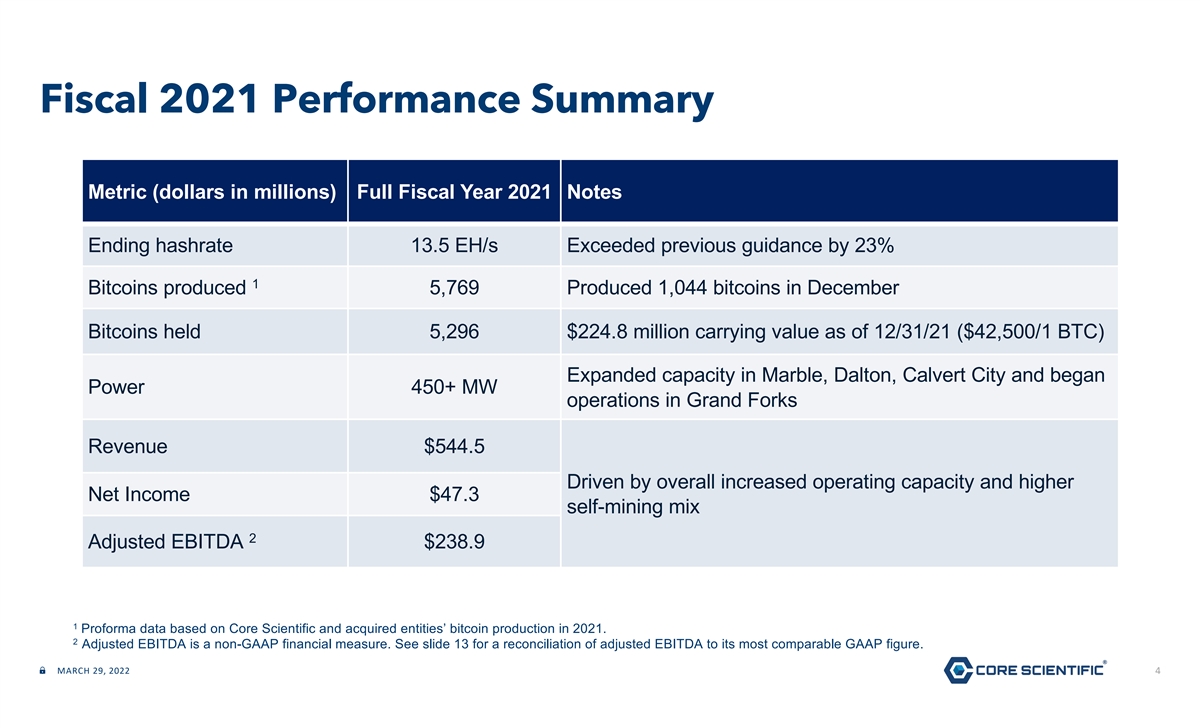
Fiscal 2021 Performance Summary Metric (dollars in millions) Full Fiscal Year 2021 Notes Ending hashrate 13.5 EH/s Exceeded previous guidance by 23% 1 Bitcoins produced 5,769 Produced 1,044 bitcoins in December Bitcoins held 5,296 $224.8 million carrying value as of 12/31/21 ($42,500/1 BTC) Expanded capacity in Marble, Dalton, Calvert City and began Power 450+ MW operations in Grand Forks Revenue $544.5 Driven by overall increased operating capacity and higher Net Income $47.3 self-mining mix 2 Adjusted EBITDA $238.9 1 Proforma data based on Core Scientific and acquired entities’ bitcoin production in 2021. 2 Adjusted EBITDA is a non-GAAP financial measure. See slide 13 for a reconciliation of adjusted EBITDA to its most comparable GAAP figure. MARCH 29, 2022 4
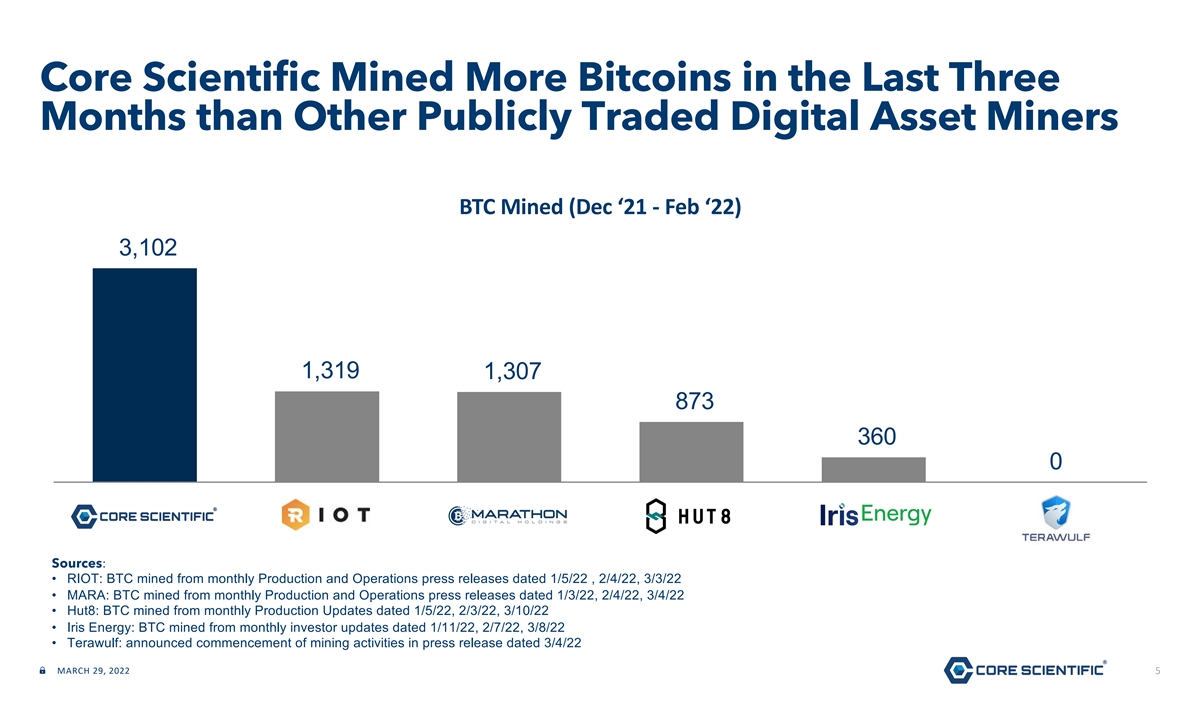
Core Scientific Mined More Bitcoins in the Last Three Months than Other Publicly Traded Digital Asset Miners Market Leader In A Large, Growing Market 457 BTC Mined (Dec ‘21 - Feb ‘22) 350 3,102 (1) 144 105 2021 MW Online 50 30 1,319 1,307 4000 873 3,102 3500 3000 2500 BTC Mined 2000 360 1,319 1,307 1500 873 1000 (Dec 21 Feb 22) 0 361 500 NM 0 Core Scientific Riot Blockchain Marathon Hut 8 Iris Energy Terawulf Sources: (5) • RIOT: BTC mined from monthly Production and Operations press releases dated 1/5/22 , 2/4/22, 3/3/22 41 45 40 • MARA: BTC mined from monthly Production and Operations press releases dated 1/3/22, 2/4/22, 3/4/22 35 (2) • Hut8: BTC mined from monthly Production Updates dated 1/5/22, 2/3/22, 3/10/22 30 23 2022 Expected 25 • Iris Energy: BTC mined from monthly investor updates dated 1/11/22, 2/7/22, 3/8/22 (3) 20 13 • Terawulf: announced commencement of mining activities in press release dated 3/4/22 15 10 Hash Rate 7 6 10 5 (4) MARCH 29, 2022 5 (EH/s) 0 Source: Equity Research, Company Presentations. 1) Does not include capacity outsourced by third parties. 2) Marathon is expected to deploy a total of 23 EH/s by early-2023. 3) Iris Energy indicates that 10Eh/s will be deployed by early-2023 4) Hash rate includes both mining and hosting. 5) Represents midpoint of 40 EH/s to 42 EH/s per company guidance for 2022E performance. PROPRIETARY & CONFIDENTIAL 12
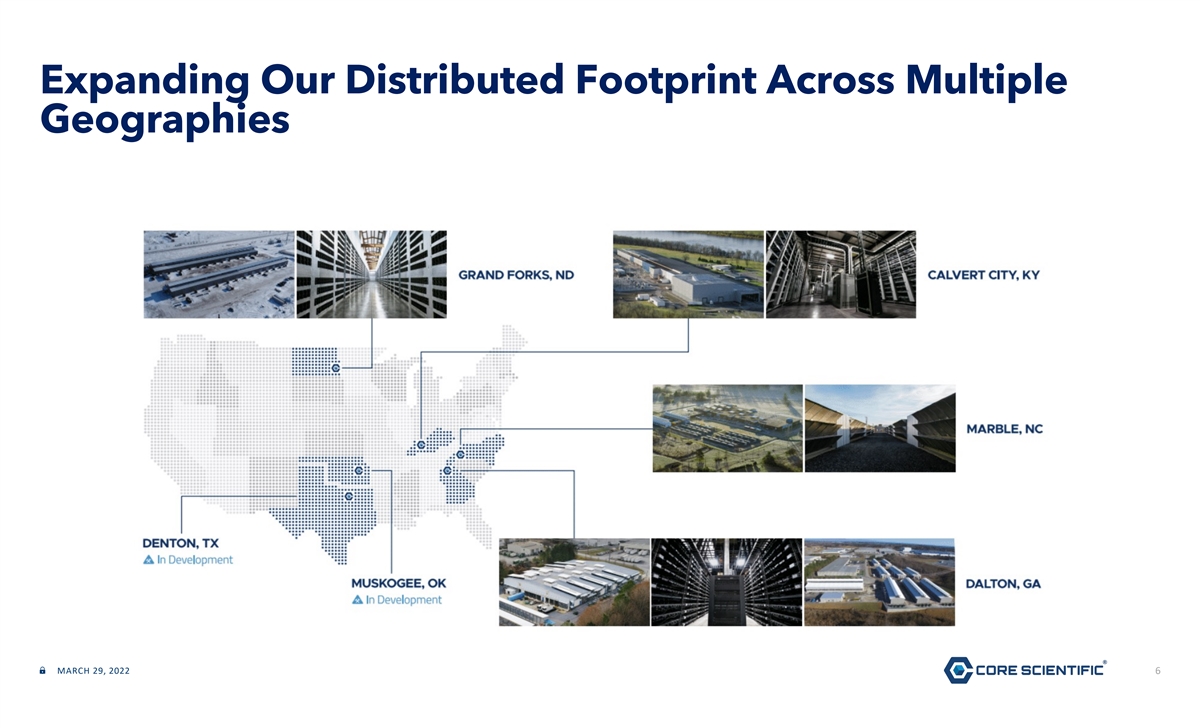
Expanding Our Distributed Footprint Across Multiple Geographies MARCH 29, 2022 6
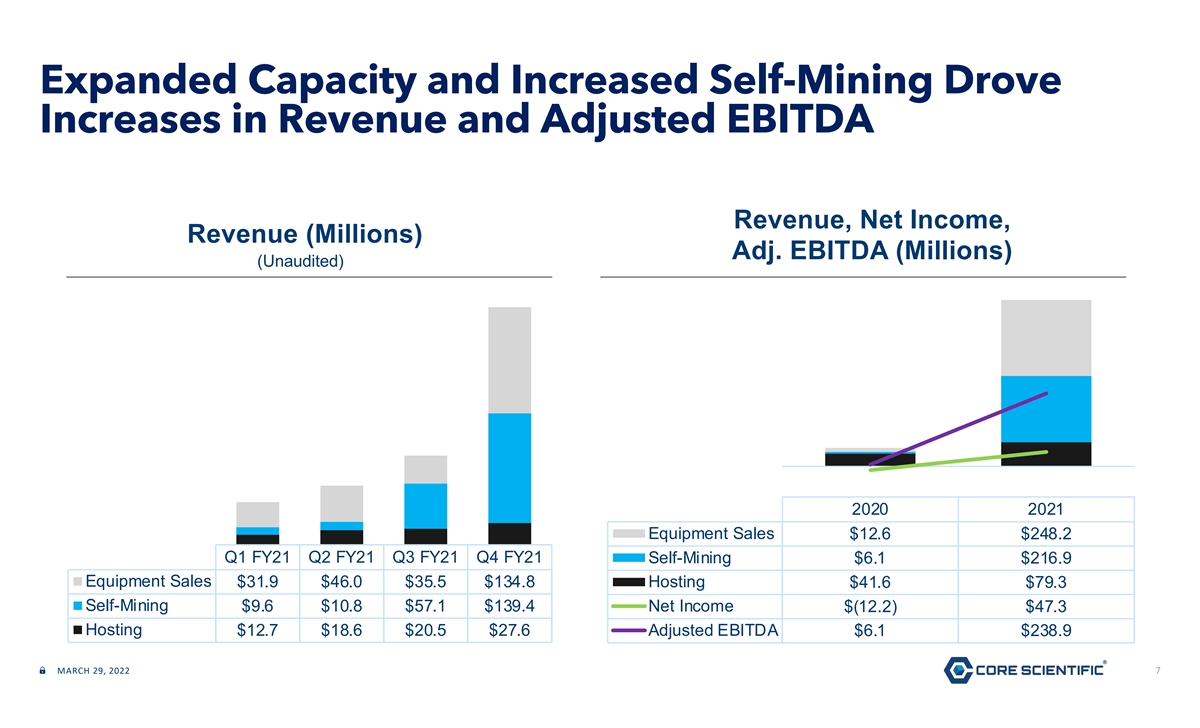
Expanded Capacity and Increased Self-Mining Drove Increases in Revenue and Adjusted EBITDA Revenue, Net Income, Revenue (Millions) Adj. EBITDA (Millions) (Unaudited) 2020 2021 Equipment Sales $12.6 $248.2 Q1 FY21 Q2 FY21 Q3 FY21 Q4 FY21 Self-Mining $6.1 $216.9 Equipment Sales $31.9 $46.0 $35.5 $134.8 Hosting $41.6 $79.3 Self-Mining $9.6 $10.8 $57.1 $139.4 Net Income $(12.2) $47.3 Hosting $12.7 $18.6 $20.5 $27.6 Adjusted EBITDA $6.1 $238.9 MARCH 29, 2022 7
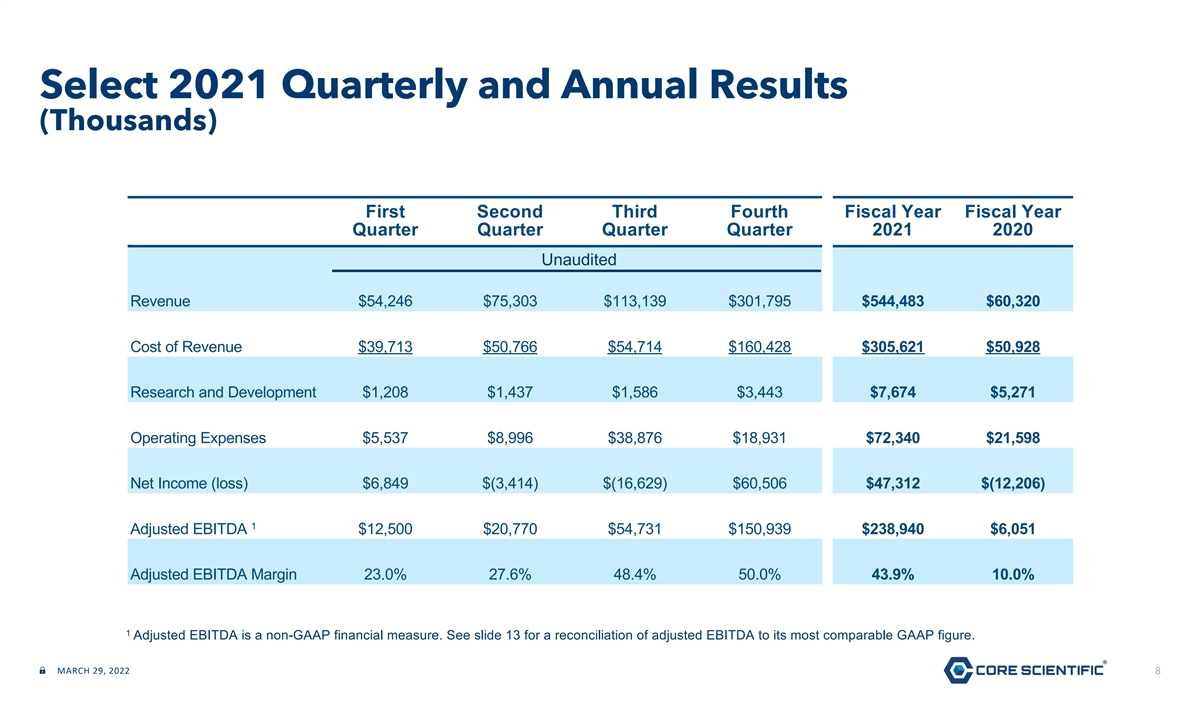
Select 2021 Quarterly and Annual Results (Thousands) First Second Third Fourth Fiscal Year Fiscal Year Quarter Quarter Quarter Quarter 2021 2020 inasdf Unaudited Revenue $54,246 $75,303 $113,139 $301,795 $544,483 $60,320 Cost of Revenue $39,713 $50,766 $54,714 $160,428 $305,621 $50,928 Research and Development $1,208 $1,437 $1,586 $3,443 $7,674 $5,271 Operating Expenses $5,537 $8,996 $38,876 $18,931 $72,340 $21,598 Net Income (loss) $6,849 $(3,414) $(16,629) $60,506 $47,312 $(12,206) 1 Adjusted EBITDA $12,500 $20,770 $54,731 $150,939 $238,940 $6,051 Adjusted EBITDA Margin 23.0% 27.6% 48.4% 50.0% 43.9% 10.0% 1 Adjusted EBITDA is a non-GAAP financial measure. See slide 13 for a reconciliation of adjusted EBITDA to its most comparable GAAP figure. MARCH 29, 2022 8
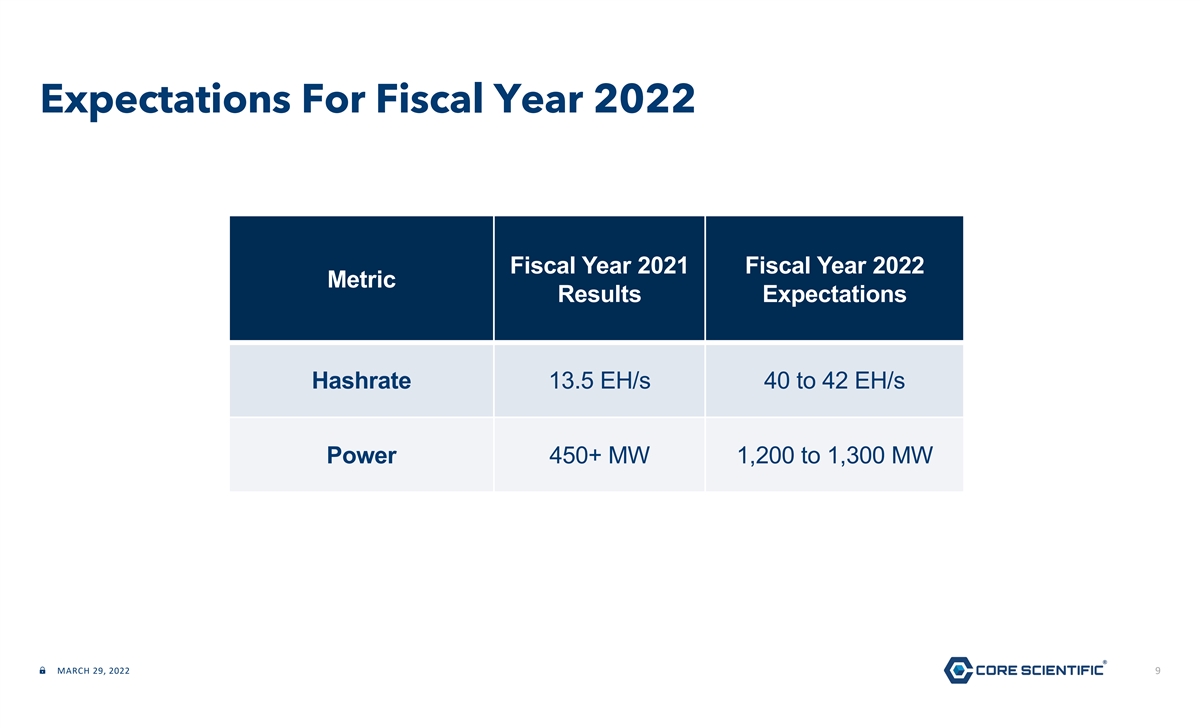
Expectations For Fiscal Year 2022 Fiscal Year 2021 Fiscal Year 2022 Metric Results Expectations Hashrate 13.5 EH/s 40 to 42 EH/s Power 450+ MW 1,200 to 1,300 MW MARCH 29, 2022 9
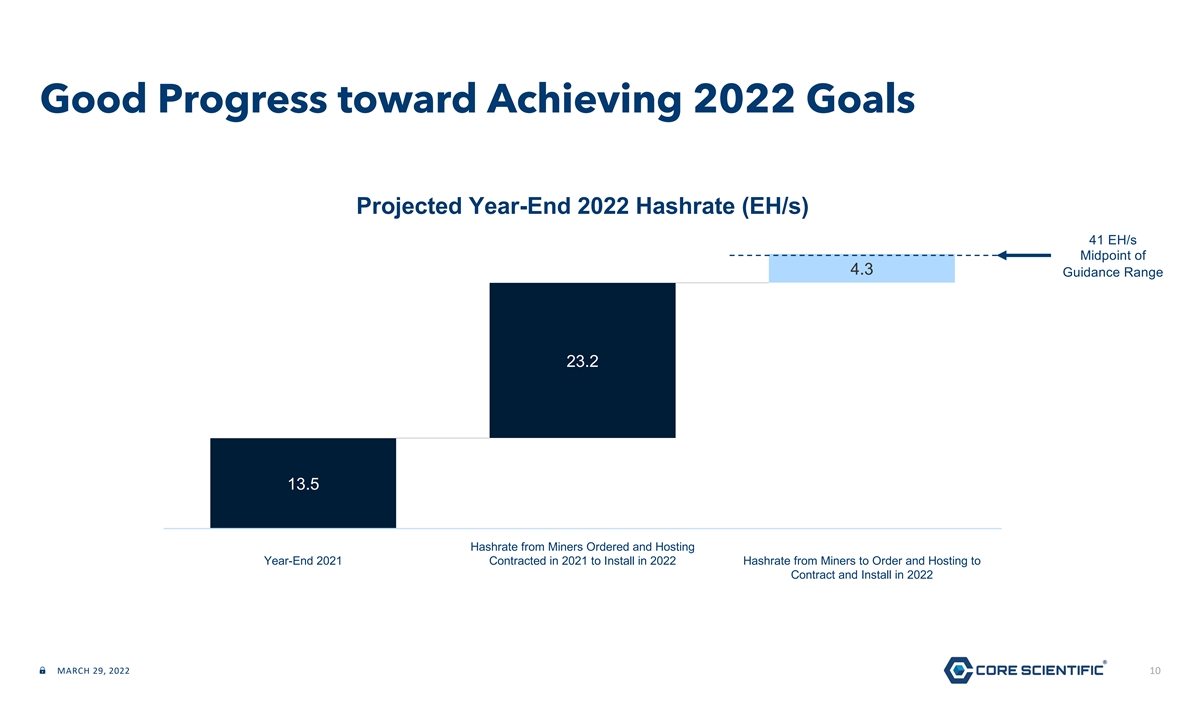
Good Progress toward Achieving 2022 Goals Projected Year-End 2022 Hashrate (EH/s) 41 EH/s Midpoint of 4.3 Guidance Range 1 23.2 13.5 Hashrate from Miners Ordered and Hosting Year-End 2021 Contracted in 2021 to Install in 2022 Hashrate from Miners to Order and Hosting to Contract and Install in 2022 MARCH 29, 2022 10
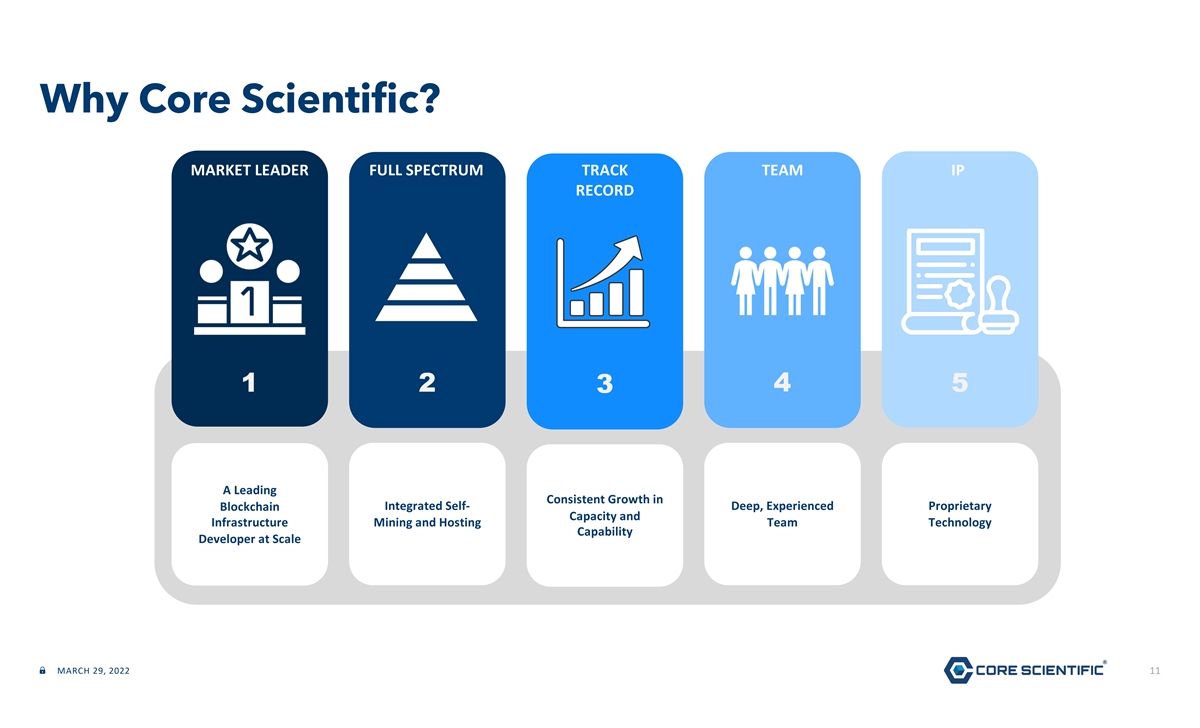
Why Core Scientific? MARKET LEADER FULL SPECTRUM TRACK TEAM IP RECORD 1 2 4 5 3 A Leading Consistent Growth in Integrated Self- Deep, Experienced Proprietary Blockchain Capacity and Infrastructure Mining and Hosting Team Technology Capability Developer at Scale MARCH 29, 2022 11
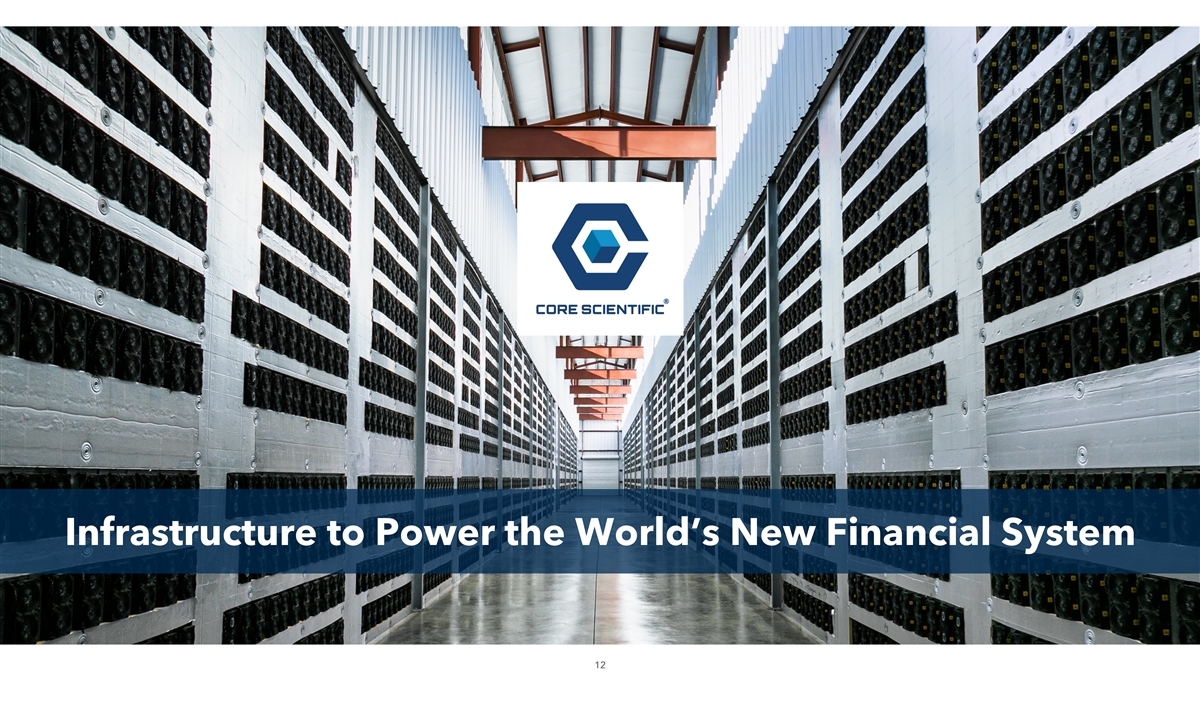
Infrastructure to Power the World’s New Financial System 12
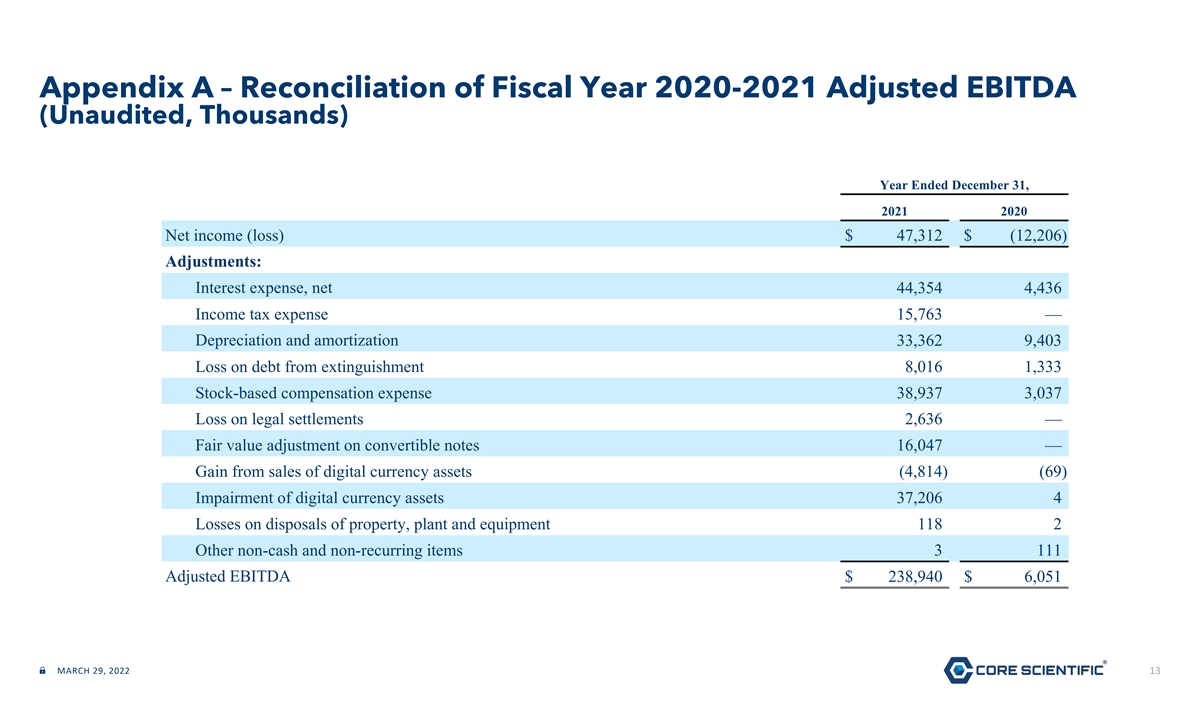
Appendix A – Reconciliation of Fiscal Year 2020-2021 Adjusted EBITDA (Unaudited, Thousands) Year Ended December 31, 2021 2020 Net income (loss) $ 47,312 $ (12,206) Adjustments: Interest expense, net 44,354 4,436 Income tax expense 15,763 — Depreciation and amortization 33,362 9,403 Loss on debt from extinguishment 8,016 1,333 Stock-based compensation expense 38,937 3,037 Loss on legal settlements 2,636 — Fair value adjustment on convertible notes 16,047 — Gain from sales of digital currency assets (4,814) (69) Impairment of digital currency assets 37,206 4 Losses on disposals of property, plant and equipment 118 2 Other non-cash and non-recurring items 3 111 Adjusted EBITDA $ 238,940 $ 6,051 MARCH 29, 2022 13